Lettuce, tomato and papaya price variations in the city of São Paulo after frost and climate change with Decision Tree and Randon Forest approaches
By Daniel Christian Henrique, Luiz Ricardo Mendes da Silva, João Carlos Prats Ramos and Gianpiero Camargo Bedin
Continuing the series of posts that we started in relation to variations in food prices in various regions of the country after winter frosts and possible climate changes, via the use of Machine Learning applications in the Deciosion Tree and Randon Forest models, we will now discuss on the variations in the prices of long life tomato, crisp lettuce and papaya formosa in the city of São Paulo, under the impact of meteorological variables measured by Inmet in the region of Mirante de Santana. These three products were chosen for analysis because they are one of the most affected in the city of São Paulo by the extreme cold and frost this winter, as well as the fact that tomatoes and lettuce are in the top 5 of the market cultures most consumed by Brazilians in their daily lives - with tomatoes taking first place with 25% of consumption and lettuce the fourth place, as well as this being the most consumed hardwood in Brazilian dishes, reaching a significant 47% of the total production in the segment (ABCSEM, 2016). Additionally, temperatures as low as those recorded that year are uncommon for the capital and more frequent for its metropolitan region (EXAME, 2021).
As a result, Ceagesp recorded a 16.47% increase in the prices of the 3A long life tomato salad, one of the most consumed by Brazilians, in the week of August 2nd to 6th (HF BRASIL, 2021a). The state of São Paulo still needed, at times, to supply its demand with hardwoods from the states of Minas and Rio de Janeiro, due to the reduction in its supply with the strong frosts and intense cold that ruined the lettuce planting in several of its gardens. However, starting in early August, the population's more limited income in the period, added to the lower demand for bars and restaurants in the face of the pandemic, made it possible that the increases were not even more expressive (HF BRASIL, 2021b, 2021c). The same happened with the form of papaya formosa, in which the intense cold in July impacted its price increase in all regions of the country, but also with controlled highs due to lower demand caused by the context of the pandemic (HF BRASIL, 2021d).
The time series of the daily prices of lettuce, tomato and papaya in the capital of São Paulo were obtained from CEPEA/ESALQ/USP (2021) January 2015 to August 30, 2021. In sequence, they were transferred to the monthly period and calculated on their return, aiming to evaluate the highs or lows in the percentage variations of its price and make it closer to stationarity. Meteorological data were obtained for the same period in hourly data from Inmet (2021), with further adjustments for monthly series. For Machine Learning applications related to Decision Tree and Randon Forest tools, it was decided to separate the data into 70% for training and 30% for testing. As in the previous report on Arabica coffee, variables were collected that could generate the different slopes of frost - advection, radiation, mixed, black or white or arising from climate change:
- Precipitation in mm,- Pressure in hPa,- Radiation in KJ/m²,- Bulb temperature in ºC,- Dew temperature in ºC,- Humidity in %- Wind in m/s.
In sequence, the results from the Decision Tree applications. In Machine Learning analyses, according to Baldé (2020), the algorithm learns autonomously without the need for adjustments in the time series, as occurs in econometric models such as in the cases of autoregressive vectors (VAR) or error correction vectors (VEC) . However, it is reported that practically all variables were shown to be stationary by the ADF test, even though it is not a prerequisite for these analyses. The accuracy tests of the generated models are also posted in sequence for each tree:
Decision Tree Tomato:
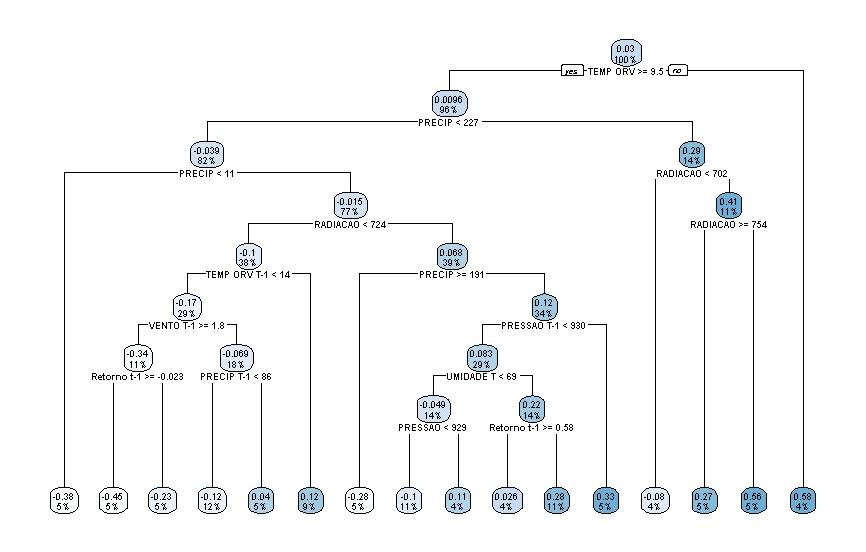
Table 1: Decision Tree Tomato accuracy tests
| RMSE | MAE | MAPE |
| 0.5655598 | 0.4552525 | 2.255714 |
Highest monthly low percentages in tomato price variations:
-45% (5% of cases) = dew temperature >= 9.5ºC; precipitation > 11 mm; radiation < 724 KJ/m²; dew temperature t-1 < 14°C; wind t-1 > 1.8 m/s; tomato return t-1 >= -2.3%
-38% (5% of cases) = dew temperature >= 9.5ºC; precipitation < 11 mm
Highest monthly percentages in tomato price variations:
+58% (4% of cases) = dew temperature <= 9.5ºC
+56% (5% of cases) = dew temperature >= 9.5ºC; precipitation > 227 mm; radiation >= 754 KJ/m²
Decision Tree Lettuce:
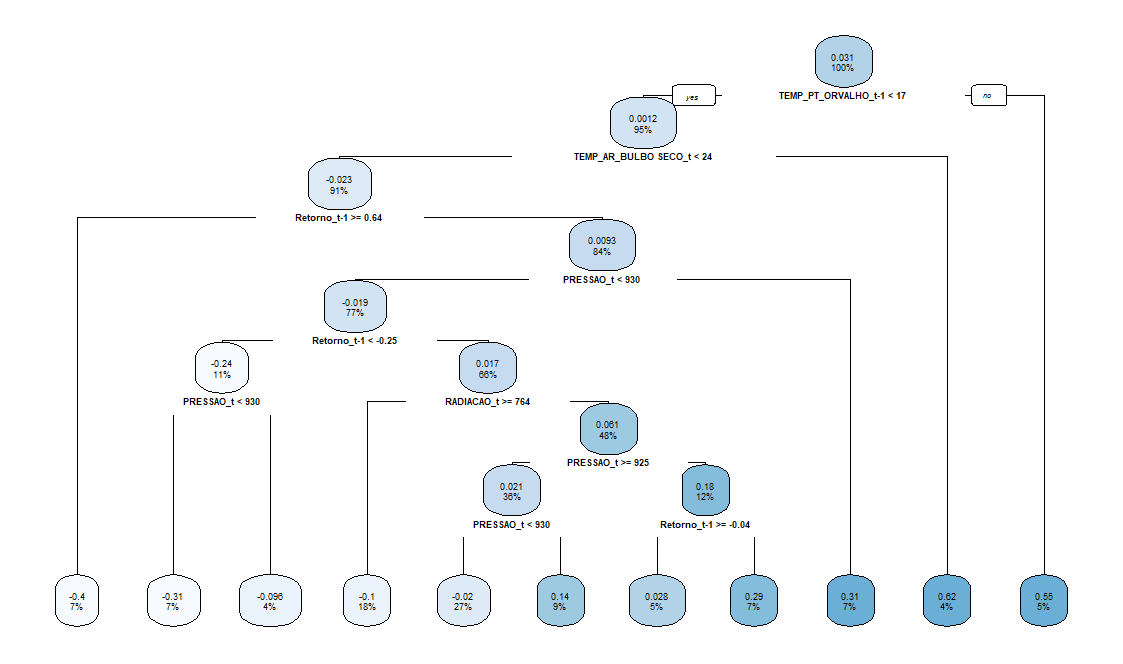
Table 2: Decision Tree Lettuce accuracy tests
| RMSE | MAE | MAPE |
| 0.3892931 | 0.2855045 | 2.255714 |
Highest monthly low percentages in lettuce price variations:
-40% (7% of cases): dew temperature at t-1< 17ºC; bulb temperature < 24°C; lettuce return at t-1 >= 64%
-31% (7% of cases): dew temperature at t-1< 17ºC; bulb temperature < 24°C; lettuce return at t-1 < 64%; pressure < 930 hPa; lettuce return at t-1 < -25%
Highest monthly percentages in lettuce price variations:
+62% (4% of cases): dew temperature at t-1 < 17°C; bulb temperature > 24°C
+55% (5% of cases): dew temperature at t-1 > 17°C
Decision Tree Papaya:
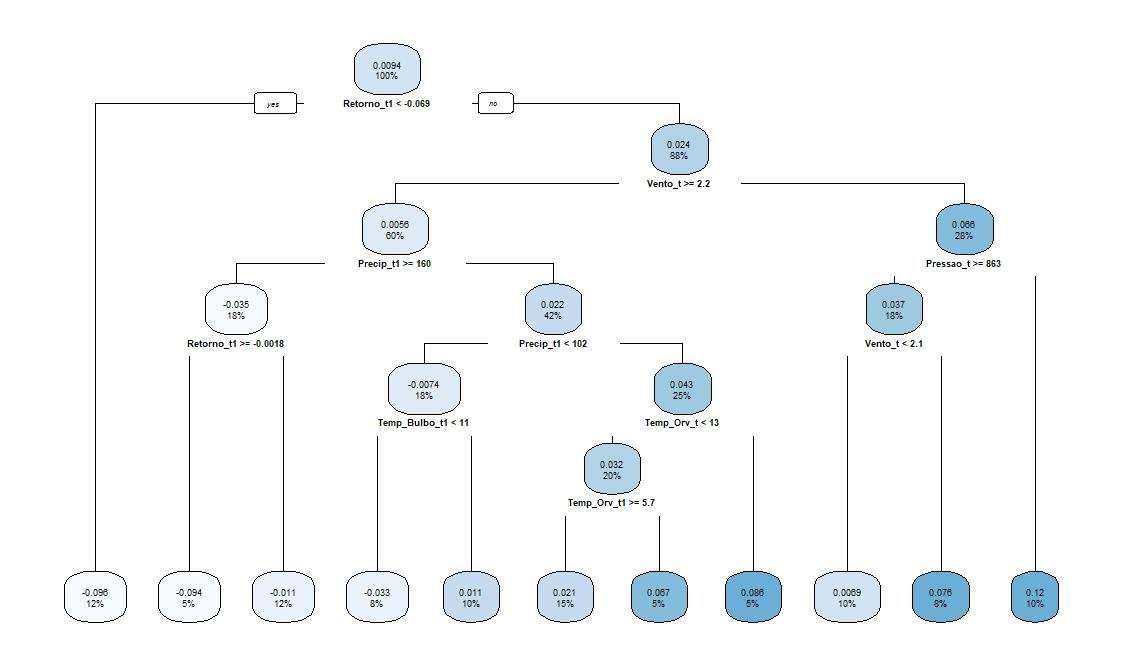
Table 3: Decision Tree Papaya accuracy tests
| RMSE | MAE | MAPE |
| 0.6807128 | 0.5439924 | 3.406211 |
Lowest monthly percentages in the price of papaya:
-0.96% (12% of cases): papaya return t-1 < -0.69%
-0.94% (5% of cases): papaya return t-1 > -0.69%; wind >= 2.2 m/s; precipitation >= 160 mm; papaya t-1 return >= -0.018%
Highest monthly percentages in the price of papaya:
+12% (10% of cases): papaya return t-1 > -0.69%; wind < 2.2 m/s; pressure <863 hPa
+ 0.86% (5% of cases): papaya t-1 return > -0.69%; wind >= 2.2 m/s; precipitation t-1 > 102 and < 160 mm; dew temperature > 13°C
Below are simulations for the various types of frost and other climate changes using the Randon Forest methodology, covering 30 tree variations in each simulation and their respective accuracy tests. It is observed that all models improved their results:
Table 4: Randon Forest Tomato accuracy tests
| RMSE | MAE | MAPE |
| 0.4213141 | 0.313559 | 1.968527 |
Random Forest Tomato - Radiation Frost Simulation:
| Variable | Variation % | ||
| RADIATION | -50% | -50% | 100% |
| PRECIPITATION | 0% | 0% | 0% |
| PRESSURE | 100% | 50% | 0% |
| BULB TEMPERATURE | -50% | 0% | 0% |
| DEW TEMPERATURE | -50% | 0% | 0% |
| MOISTURE | 0% | 0% | 0% |
| WIND | 0% | 0% | 0% |
| Difference in the monthly percentage change in tomato price | 27,23% | 9,87% | 2,32% |
Randon Forest Tomato - Mixed Frost Simulation:
| Variable | Variation % | |
| RADIATION | -50% | -50% |
| PRECIPITATION | 0% | 0% |
| PRESSURE | 0% | 100% |
| BULB TEMPERATURE | -40% | -50% |
| DEW TEMPERATURE | -40% | -50% |
| MOISTURE | 0% | 0% |
| WIND | 250% | 300% |
| Difference in the monthly percentage change in tomato price | 19,40% | 24,77% |
Randon Forest Tomate - Simulation of White Frost and Advection:
| Variable | Variation Advection % | White Variation% | |
| RADIATION | 0% | 0% | 0% |
| PRECIPITATION | 0% | 0% | 0% |
| PRESSURE | 0% | 0% | 0% |
| BULB TEMPERATURE | -50% | -40% | -80% |
| DEW TEMPERATURE | -50% | -40% | -80% |
| MOISTURE | 0% | 0% | 300% |
| WIND | 200% | 250% | 0% |
| Difference in the monthly percentage change in tomato price | 16,60% | 15,35% | 38,22% |
Randon Forest Tomate - Simulation of rainfall variations:
| Variables | Change % | |||
| RADIATION | 0% | 0% | 0% | 0% |
| PRECIPITATION | 50% | 100% | -50% | -100% |
| PRESSURE | 0% | 0% | 0% | 0% |
| BULB TEMPERATURE | 0% | 0% | 0% | 0% |
| DEW TEMPERATURE | 0% | 0% | 0% | 0% |
| MOISTURE | 0% | 0% | 0% | 0% |
| WIND | 0% | 0% | 0% | 0% |
| Difference in the monthly percentage change in tomato price | 1,94% | 3,23% | 0,46% | -0,70% |
The following are the accuracy tests of the Randon Forest model for papaya and the simulations of possible white frosts or advection:Table 5: Randon Forest Papaya Accuracy Tests
| RMSE | MAE | MAPE |
| 0.5291455 | 0.3797963 | 1.383193 |
Randon Forest Papaya - Simulation of White Frost and Advection:
| Variable | Variation Advecção % | White Variation% |
| RADIATION | 0% | 0% |
| PRECIPITATION | 0% | 0% |
| PRESSURE | 0% | 0% |
| BULB TEMPERATURE | -4ºC | -4ºC |
| DEW TEMPERATURE | -4ºC | -4ºC |
| MOISTURE | 0% | 70% |
| WIND | 50% | 0% |
| Difference in the monthly percentage change in the price of Papaya | 37,85% | 36,17% |
Finally, the accuracy tests of the Randon Forest model for lettuce and simulations of possible frosts and rainfall variations are presented, simulating droughts or increases in rainfall indices:Table 6: Randon Forest Lettuce Accuracy Tests
| RMSE | MAE | MAPE |
| 0.4213141 | 0.313559 | 1.968527 |
Randon Forest Lettuce - Frost Simulation of Advection and Mixed:
| Variable | Variation Advecção % | Mixed Change % | ||
| Radiation | 0% | 0% | 100% | 2 |
| Precipitation | 0% | 0% | 0% | 0 |
| Pressure | 0% | 0% | 0% | 0 |
| Temp. Bulb | -50% | -150% | -50% | -0,8 |
| Temp. Dew | -50% | -150% | -50% | -0,8 |
| Moisture | 0% | 0% | 0% | 0 |
| Wind | 100% | 250% | 100% | 2 |
| Difference in the monthly percentage change in lettuce price | -9,09% | -9,08% | -6,68% | -6,67% |
Randon Forest Lettuce - Radiation Frost Simulation, Black, Mixed and White:
| Variable | Variation Advecção % | Radiation% Variation | Black Variation % | Mixed Change % | White Variation% |
| Radiation | 0% | 100% | -150% | 2 | 0% |
| Precipitation | 0% | 0% | 0% | 0 | 0% |
| Pressure | 0% | 0% | 0% | 0 | 0% |
| Temp. Bulb | -150% | 0% | -150% | -0,8 | -150% |
| Temp. Dew | -150% | 0% | -150% | -0,8 | -150% |
| Moisture | 0% | 0% | -200% | 0 | 400% |
| Wind | 250% | 0% | 0% | 2 | 0% |
| Difference in the monthly percentage change in lettuce price | -9,08% | 2,92% | 1,07% | -6,67% | -6,97% |
Randon Forest Lettuce - Rainfall Variation Simulation:
| Variable | Variation Rainfall% | |||
| Radiation | 0% | 0% | 0% | 0% |
| Precipitacao | 50% | 70k | -50% | -85% |
| Pressure | 0% | 0% | 0% | 0% |
| Temp. Bulb | 0% | 0% | 0% | 0% |
| Temp. Dew | 0% | 0% | 0% | 0% |
| Moisture | 0% | 0% | 0% | 0% |
| Wind | 0% | 0% | 0% | 0% |
| Difference in the monthly percentage change in lettuce price | 4,30% | 5,81% | 1,11% | 1,27% |
In general, the tomato presented the highest monthly variations in the price compared to the simulations of radiation frosts and mixed frosts, as well as also presented the highest highs with papaya in the occurrence of possible white frosts, with a small percentage difference between both. Papaya, in turn, presented the highest monthly high in a possible advection frost. Lettuce was the food that presented the lowest percentages, including low prices - usually caused by the sale for lower values compared to a product still liable to consumption, although relatively "burned" by frost.
With regard to rainfall variations, simulating periods of droughts or excessive rainfall, clearly the price variations were much less significant than in the case of frosts, because in the latter case the whole harvest is usually lost, with exceptions in cases where it is sold for lower prices with lower quality due to burning. Periods of droughts and excessive rainfall impact prices, but it was noted that the absence of significant increases denote that such situations do not lose the entire crop.
However, it is emphasized that because they are foods of the population's feeding routine, small percentages of variation are sufficient to impact the finances of são Paulo consumers.As for the simulations of increased rainfall rates, both tomatoes and lettuce presented monthly increases with percentages ranging from 3% to 6% in their prices in the state capital in the face of gradual increases in rainfall volumes in it. From the perspective of simulations of gradual reduction of rains, simulating more pronounced periods of droughts, the tomato showed a slight increase in prices, the fall of 50% of the rains and a slight reduction in prices with a 100% drop in rainfall. The tomato, in turn, presented a slight increase in both situations, but much less expressive in comparison to the increase in rainfall.
References
ABCSEM. O Mercado de Folhosas: Números e Tendências. Associação Brasileira de Comércio de Sementes e Mudas. Folhosas Seminário Nacional. Available in: https://www.abcsem.com.br/upload/arquivos/O_mercado_de_folhosas__Numeros_e_Tendencias_-_Steven.pdf. Access : 20 out. 2016
CEPEA/ESALQ/USP. Available in: https://www.cepea.esalq.usp.br/br. Access 20 mai. 2021. BALDÉ, Amadú. Econometria Vs. Machine Learning: Big Data em Finanças. Dissertação de mestrado. Universidade de Lisboa/Departamento de Matemática. Instituto Universitário de Lisboa/Departamento de Finanças, 2020.
EXAME. Frente fria: neve chega ao Brasil e geada é esperada nesta madrugada em SP. Available in: https://exame.com/brasil/frente-fria-neve-chega-ao-brasil-e-geada-e-esperada-nesta-madrugada-em-sp/. Access 27 nov. 2021.
HF BRASIL. TOMATE/CEPEA: Geada e frio diminuem oferta e preços sobem. Available in: https://www.hfbrasil.org.br/br/tomate-cepea-geada-e-frio-diminuem-oferta-e-precos-sobem.aspx. Access 27 nov. 2021a.
HF BRASIL. MG e RJ cobrem baixa oferta de alface de estados com geada. Available in: https://www.hfbrasil.org.br/br/mg-e-rj-cobrem-baixa-oferta-de-alface-de-estados-com-geada.aspx. Access 27 nov. 2021b.
HF BRASIL. ALFACE/CEPEA: Mesmo com baixa procura, preços se elevam em agosto. Available in: https://www.hfbrasil.org.br/br/alface-cepea-mesmo-com-baixa-procura-precos-se-elevam-em-agosto.aspx. Access 27 nov. 2021c.
HF BRASIL. MAMÃO/CEPEA: Preço sobe, mas demanda limita melhores resultados. Available in: https://www.hfbrasil.org.br/br/mamao-cepea-preco-sobe-mas-demanda-limita-melhores-resultados.aspx. Access 27 nov. 2021d.
INMET. Dados históricos anuais. Available in: https://portal.inmet.gov.br/dadoshistoricos. Access15 abr. 2021.