Medical, hospital and diagnostic services subsector: from exorbitant profit in 2020 to break even in 2022. A study by Principal Component Analysis and Correlations
By Daniel Christian Henrique e Ivan Aune de Aguiar Filho (Probolsas extension scholarship holder)
Let's start with a comparison to make it easier: in 2020, the initial year of the pandemic, the profit of the medical, hospital and diagnostic services subsector (composed of 10 companies within the health economic sector) of B3 was R$2.19 billion (equivalent to a net margin of 4.58%). At the end of 2022, already in a period of total control of the pandemic, end of lockdowns and resumption of work activities, all companies in the segment combined made only R$ 720 million in profit in the year, that is, with a net margin of 0.9% - it was almost in the tie between income and expenses!
In health plan operating companies , the situation is even more critical: combined, they obtained a mere R$2.5 million in net profit in 2022, according to the National Supplementary Health Agency (ANS) - literally a zero to zero . However, the third quarter of the year, alone, incurred a loss of R$2.5 billion.
What would have happened in this period of time? To seek answers, the following objective was generated to be investigated for this study:
Carry out a comparative analysis of the quantitative and qualitative financial situation of the medical, hospital and diagnostic subsector of B3 between the years 2020 and 2022.
This subsector is made up of the following publicly traded companies listed on B3, immersed in the healthcare sector - of greater scope:
| Name | Code on B3 |
| ALLIAR | AALR |
| DASA | DASA |
| FLEURY | FLRY |
| HAPVIDA | HAPV |
| KORA SAUDE | KRSA |
| MATER DEI | MATD |
| ODONTOPREV | ODPV |
| ONCOCLINICAS | ONCO |
| QUALICORP | WHICH |
| D OR NETWORK | RDOR |
As methodolgy, correlations between information from the companies' Income Statement and Principal Component Analysis (PCA) were adopted . In the latter, the data were scaled to avoid any bias due to differences in magnitude between the variables. The data was collected in Economatica for the years 2020 and 2022, which are:
- Net Revenue
- Gross profit
- EBITDA
- Financial income
- Net profit
Qualitative Analysis Results
Initially, we sought some qualitative reasons in financial news that would corroborate a better understanding of the quantitative findings to be investigated.
We will start with the initial year of the pandemic, 2020, with the still absence of vaccines for covid and lockdowns in force. In this situation of confinement and fear of contamination, the population stopped undergoing numerous medical exams and elective procedures, which significantly reduced the sector's costs, especially those linked to health plans in which they bear the sharing of expenses, making it possible to boost profitability of the entire segment. Some companies have even started to advertise lower and more attractive prices for their services in view of the reduction in expenses. However, without much idea of the medical chaos that would lie ahead. The problem started...
Having reached the year 2021, with the gradual resumption of activities, the population is beginning to catch up on their overdue medical exams, added to a tsunami of health problems that were generated in 2020 and not resolved, increasing the demand for care and benefits of medical services. And it gets worse : there was an increase in the costs of medical supplies, coupled with mandatory coverage of medical treatments with more expensive and sophisticated technologies.
It was now clear that the sizing of the duration of accumulated medical problems and other costing variables were calculated in a very optimistic way. According to Economatica estimates, 90% of companies in the healthcare sector ended the year with drops in their share prices of between 10% and 52%.
Some large operators in the segment additionally accused, as justification for the significant losses, the year being a pre-election period, generating political uncertainty in addition to the fiscal risk of the period. And this would get worse in 2022, in the election year. However, these setbacks were not obstacles to a strong race among companies in the subsector to carry out mergers and acquisitions (M&As) with relevant hospitals, clinical centers/laboratories and health plan operators. In this way, the increase in accident rates in 2022 of the latter impacted the profitability of the entire subsector.
The Selic Rate, In the meantime, she was a villain and at the same time a girl in the story . Villain for starting a strong sequential rise as the country left the lockdown situation, leading many to leave investments in B3 (which was coming from a record number of new investors) back to fixed income, bringing a general drop to the stock market, including the medical, hospital and diagnostic services subsector. The situation got worse until 2022 arrived and its net margin was less than 1%. At least, Selic this year was the best in history, as it enabled financial gains that saved the sector from a huge loss in its operational accounting. At its peak, the economy's basic rate reached 13.75%, catapulting many companies in the segment to carry out security applications, to generate emergency reserves - which yielded R$9.4 billion to the sector, offsetting the losses of their companies' EBITDAS and leaving them at least with some profit, even if small - practically a draw.
However, this situation has generated criticism from experts in health plan operators, when they argue that there are regulations for companies in this segment given the level of risks involved in the health sector: they have to have reserves to guarantee solvency and not have profitability. operating in the red with dependence on financial investments to close net profitability in the black.
Results in correlation matrices
Once the qualitative analyzes were complete, quantitative metrics relevant to Correlation analyzes were carried out.
Correlation Matrix 2020
| Rec Liquid | Gross profit | EBIT | Liquid Profit | Rec Finance | |
| Rec Liquid | 1 | ||||
| Gross profit | 0.82058041 | 1 | |||
| EBIT | 0.83713868 | 0.85112072 | 1 | ||
| Liquid Profit | 0.45520567 | 0.75179859 | 0.83691037 | 1 | |
| Rec Finance | 0.80870631 | 0.4379933 | 0.72779797 | 0.26782971 | 1 |
Correlation Matrix 2022
| Rec Liquid | Gross profit | EBIT | Liquid Profit | Rec Finance | |
| Rec Liquid | 1 | ||||
| Gross profit | 0.98301921 | 1 | |||
| EBIT | 0.53212687 | 0.50034442 | 1 | ||
| Liquid Profit | 0.02080415 | -0.00992694 | 0.80158825 | 1 | |
| Rec Finance | 0.70120657 | 0.65469021 | 0.92855944 | 0.66578413 | 1 |
Conclusions can be drawn :
- Financial revenues from investments significantly increased their correlation with the segment's profitability, going from 0.27 in 2020 to 0.67 in 2022 (+0.40) - when the rate was at its maximum of 13.75%;
- Consequently, the net profit of the segment that in 2020 best followed its revenue, lost ground, reducing its correlation with Net Revenue from 0.45 to 0.02;
- Costs returned to have a greater correlation with their revenues in 2022 after the resumption of the increase in their values, expressly lost in 2020 with the strong drop in demand caused by the lockdowns. Consequently, gross profit (revenue - costs) went from a correlation of 0.82 to 0.98.
Results by Principal Component Analysis
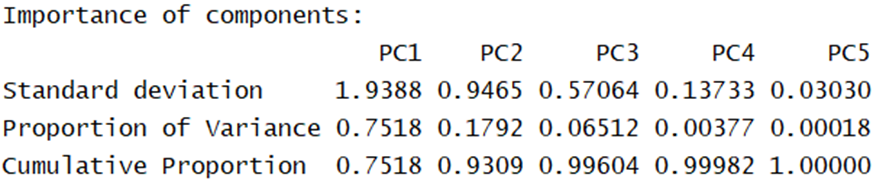
Explanation of the individual and accumulated variance of each component: Year 2020:
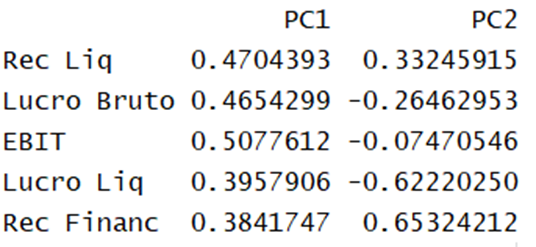
Contribution of variables to each component (up to PC2, compared to a total explanation of 93.09% of the variance). The higher it is, the greater the relationship (in both directions, positive or negative):
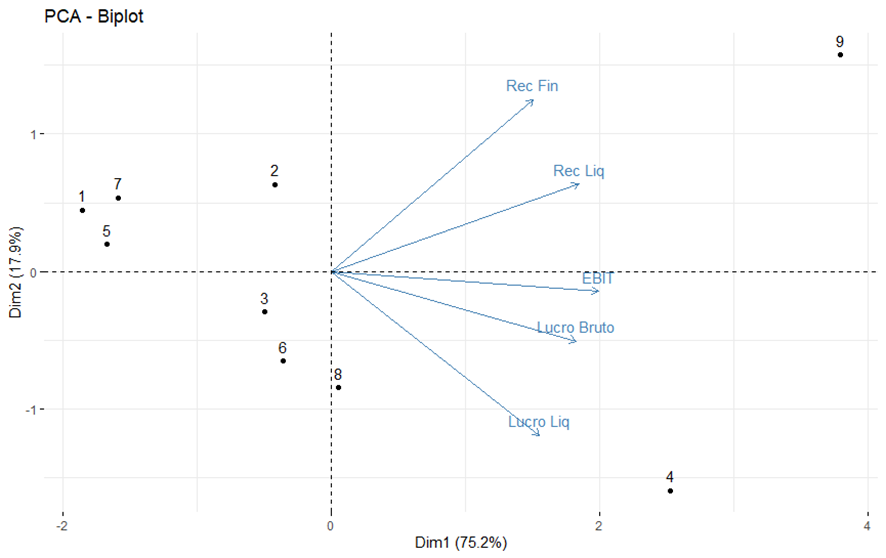
Biplot graph , for individual investigation of each company between the components and their scores:
Year 2022:
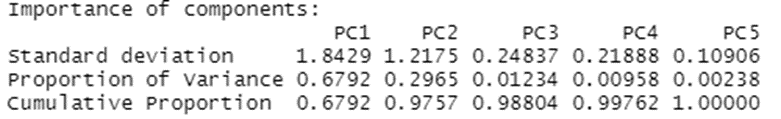
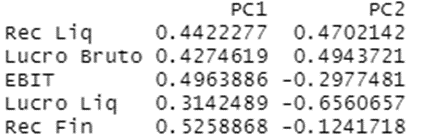
Contribution of variables (correlations) for each component (up to PC2, after 97.57% of the variance has been fully explained). The higher it is, the greater the relationship (in both directions, positive or negative):
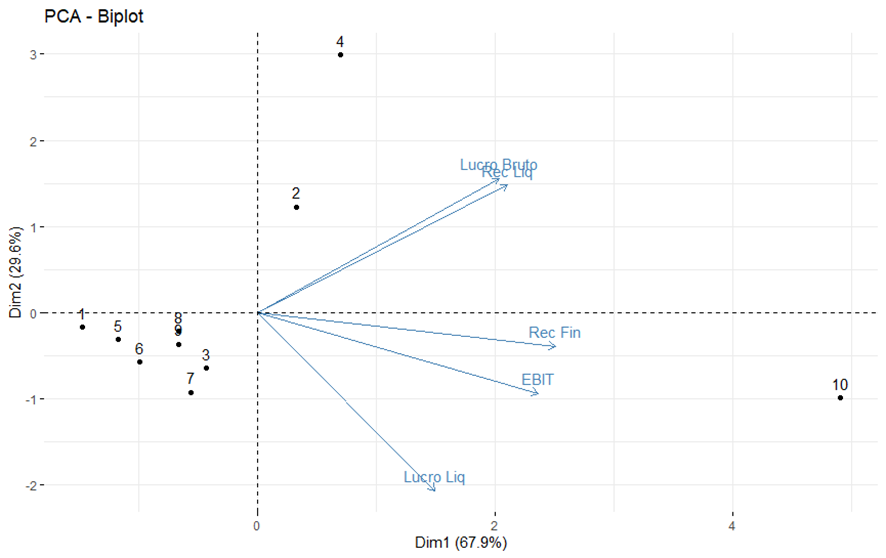
Biplot graph:
In the comparative ACP relationships between 2020 and 2022, new conclusions can be obtained, now related to the most notable performances for some individual companies:
- Considering the five variables under analysis, the component analysis managed to reduce them to just two (components) in both years, facilitating applications and understanding in cases of use for projections;
- Component 2 explains only 17.92% of the data variance in 2020, but almost doubling in 2022, with 29.65% explanation. Therefore, component 1 is expressly more relevant in both years;
- It is noted that in 2020 there is no high correlation between the variables, given the spacing between the vectors (only a median correlation between Gross Profit and EBIT). For 2022, the segment's Gross Profit and Net Revenue are strongly correlated, given the proximity of their vectors;
- Financial revenue had a balanced contribution in both components in 2020, but now has the largest contribution (0.523) in a positive direction for component 1 in 2022;
- In 2020, the company Rede D'Or (point 9) was the one that achieved the greatest prominence in terms of Net Revenue and Financial Revenue (given its closest approximation to the vectors), while the companies Hapvida (point 4) and Qualicorp ( point 8 ) were the best performers in the set of Gross Profit, EBIT and Net Profit (observation of their profit margins can help with interpretations);
- Once 2022 is reached, Net Revenue and Gross Profit will have equivalent weight in both components, but in the opposite direction to Net Profit in 2022;
- The companies Dasa (point 2) and Hapvida (point 4) were the highlights for obtaining the largest net losses in 2022, but with one of the highest Gross Profits and Net Revenues in the segment in the same year;
- The company Rede D'Or achieved the greatest relevance in 2022 in terms of positive and high EBIT, Net Profit and Financial Revenue;
References: Economatica, Forbes, E-Investidor, Correio Braziliense, CNN Brasil, Seu Dinheiro, VC SA, Blog Valor em Saúde, GZH Saúde
How to cite this newsletter? (ABNT standard)
HENRIQUE, Daniel Christian; AGUIAR-FILHO, Ivan Aune. Medical, hospital and diagnostic services subsector: from exorbitant profit in 2020 to break even in 2022. A study by Principal Component Analysis and Correlations. 2023. Developed by GPFA - Finance Analytics Research Group. Available at: https://www.gpfa.com.br/t-en-us/informes/setor-de-sa%C3%BAde-do-lucro-exorbitante-em-2020-ao-preju%C3%ADzo-em-2022. Accessed on: (date of access to the website).