Average milk price projections for Brazil and Santa Catarina: a comparison between Neural Network, Arima and Holt-Winters models
By João Carlos Prats Ramos (Probolsas scholar) and Daniel Christian Henrique
The milk production chain is a sector of great economic importance for Brazil. Today the country is the world's third largest milk producer in the world, recording an annual production of 34 billion liters per year and generating job opportunities for 4 million people, according to the Ministry of Agriculture (MAPA, 2022). On the other hand, this production is increasingly concentrated in large producers, due to the lack of investment capacity by small ones in the face of expensive technological advances (CANAL RURAL, 2022)
Santa Catarina is one of the country's prominent states in dairy production, accounting for the fourth largest production in Brazil: about 3 billion liters per year, being the third largest production chain in the state, being surpassed only by poultry and pig production. The west of Santa Catarina, in turn, agglutinates 75% of the state's milk production. Despite the strong indication of production, the state is included in the concentration of milk production as well, because in 1990 the state had 75,000 dairy farmers, but reached only 25,000 in 2022 (CANAL RURAL, 2022)
In 2022, inflation increased worldwide. In Brazil it was no different, despite the last three months of deflation, which was almost exclusively related to the drastic reduction in fuel prices by parliamentary decrees. The food and beverage segments changed little in this period (DIEESE, 2022a, 2022b, 2022c).
Recently there was a great instability in the price of milk, only this year, the value for the acquisition of the beverage totaled a high of 60% (EMBRAPA, 2022), being one of the main responsible for inflationary increases in the food and beverage sector - as can be seen in the following graph (CEPEA/ESALQ/USP, 2022):
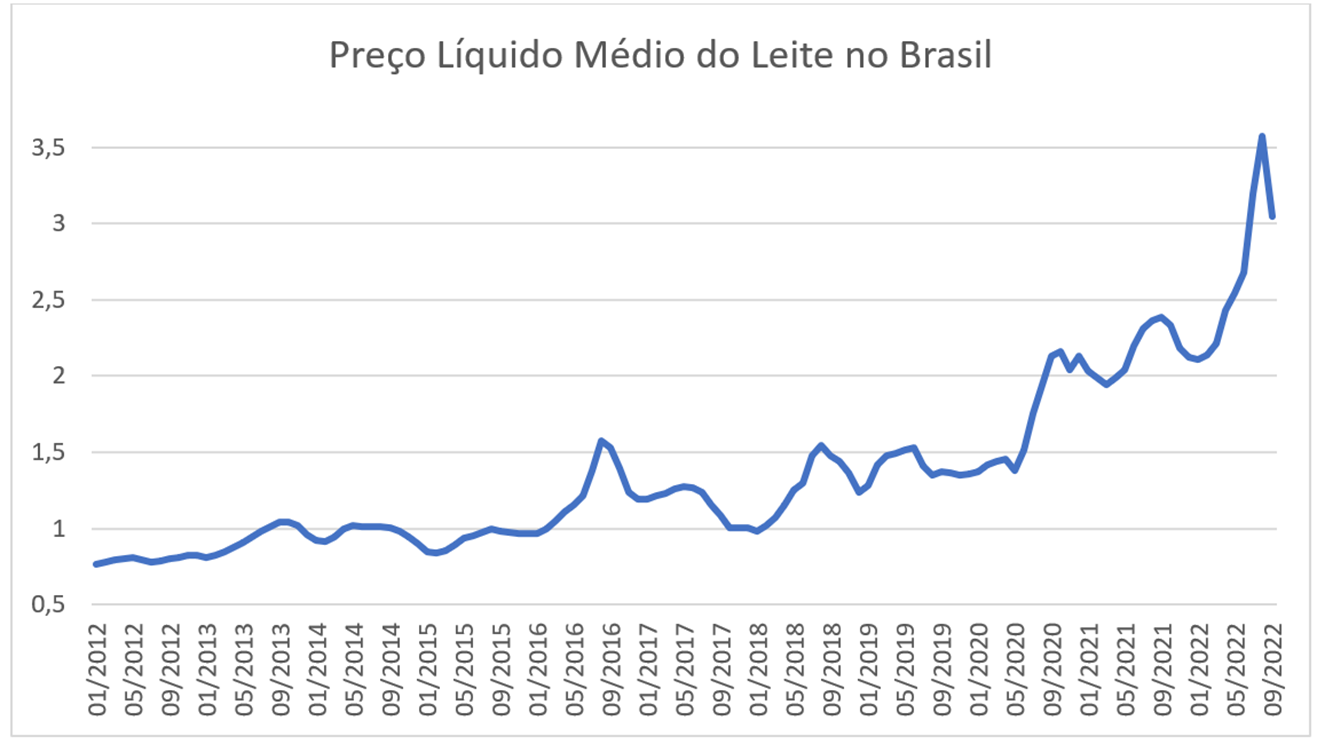
This drastic increase can be linked to the following factors, according to Embrapa (2022): (1) Off-season period in the winter months (with less pastures, consequently); (2) War in Ukraine: it has led to rising prices of fertilisers, fuels and other agricultural commodities, also making milk production more expensive; (3) Covid-19: has disorganised production worldwide and increased milk production as well as
However, there was a return of the strong rise and a 37.6% drop in the price in September compared to August. The main reasons were attributed, also by Embrapa, to (1) due to the arrival of spring in the southern hemisphere, starting in the southern states of the country; (2) better prices paid to the producer in the face of lower supply, leading them to invest more in herd feeding, generating increased milk productivity; (3) increase in imports (63% higher in August compared to July); (4) reduction of consumer demand due to the loss of purchasing power by the population in the face of high inflationary. There are projections of further falls in the coming months following increased production in the Southwest and Midwest.
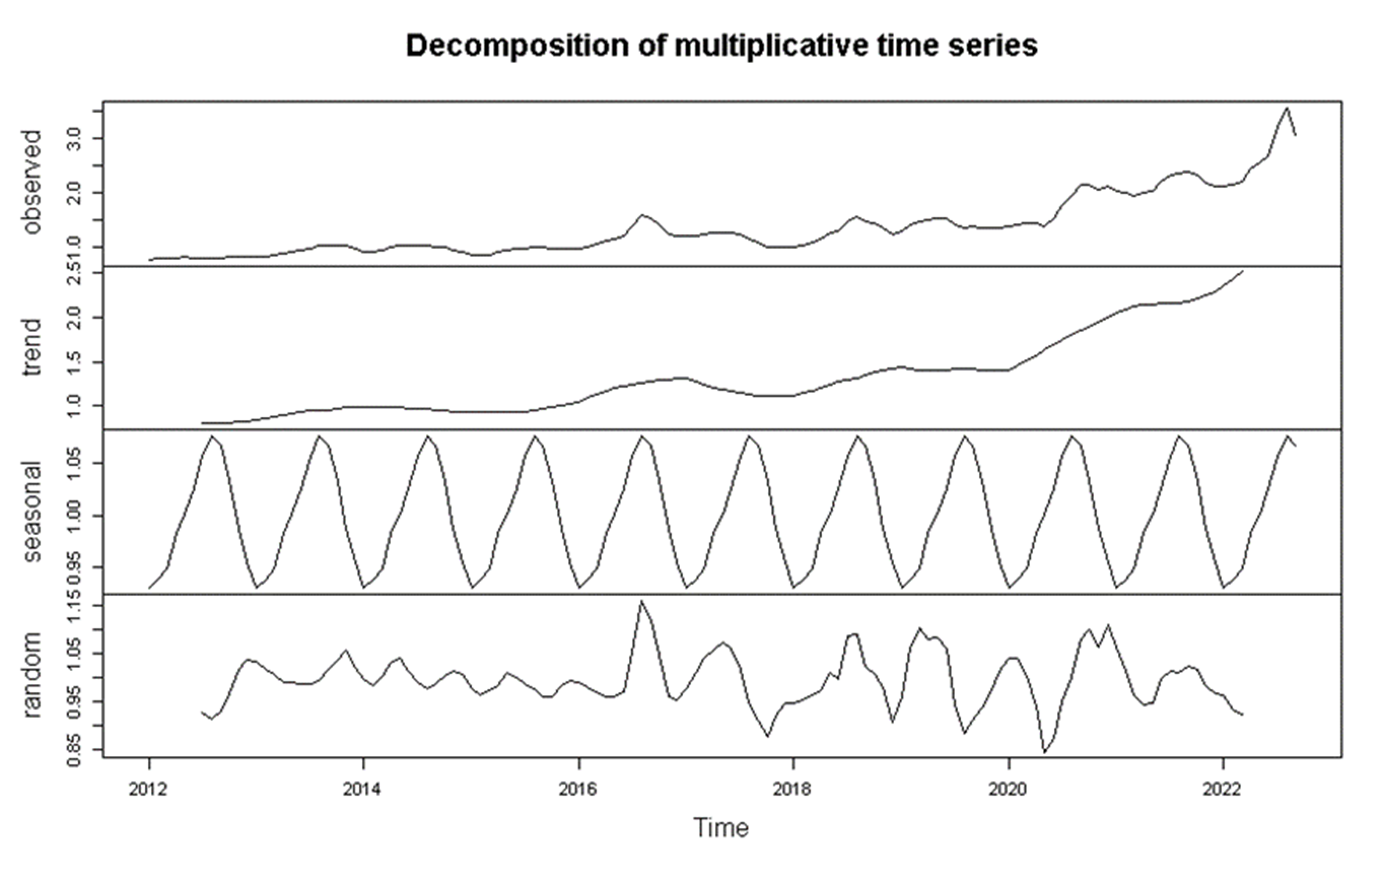
Therefore, the seasonal factor is a strong influencer in the price of milk, which have been added to several others, as seen, elapsed from sanitary, economic or even social problems. The decomposition of the milk price series in Brazil, as follows, clearly exposes its seasonality and trend of recent months:
In view of the above, four statistical models were proposed to forecast the average price of milk to the producer (R$/Liter) for the next twelve months in Brazil and the state of Santa Catarina: Arima, Holt-Winters Additive / Multiplicative and Neural Network. Both time series were collected and organized for the period between January 2012 and September 2022, collected at CEPEA/ESALQ/USP (2022).
1 - Forecast of the Average Price of Milk to the Producer in Brazil
The final chart with the forecast of average milk prices in Brazil for the next 12 months addressing four predictive models are presented below:
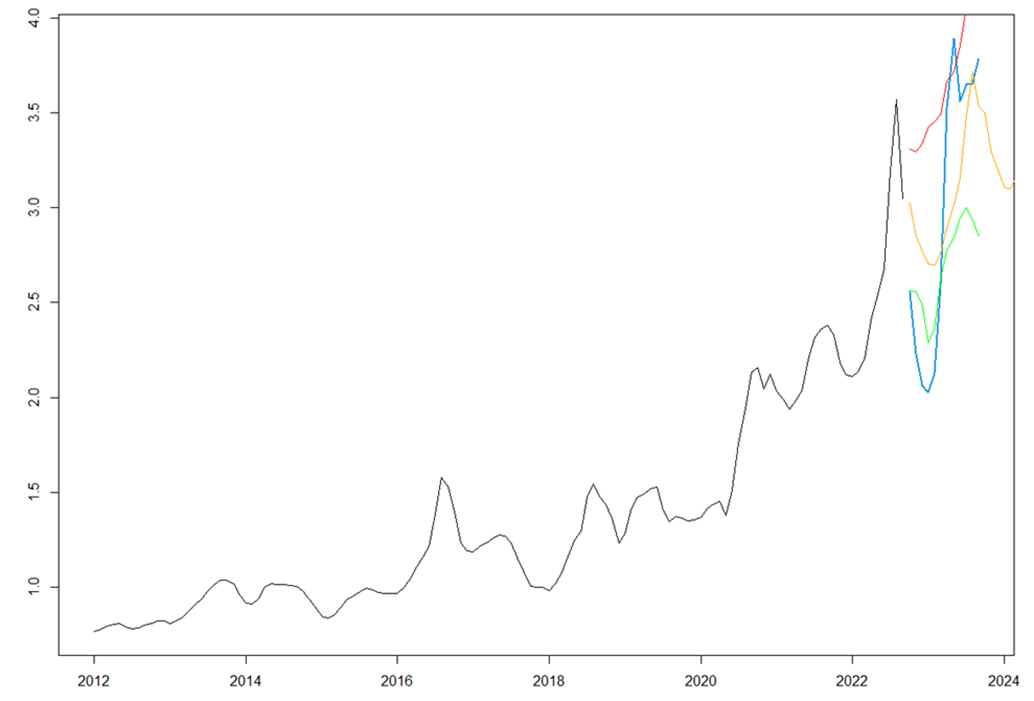
Legend: Blue = Neural Network projection; Red = Holt-Winter Additive Projection; Orange = Multiplicative Holt-Winter projection; Green = Arima projection
As an initial analysis, it is noticeable to see clear distinctions between the parameters of the models for the projections. Which would be the best? We will be responsible for the accuracy of waste error measures.
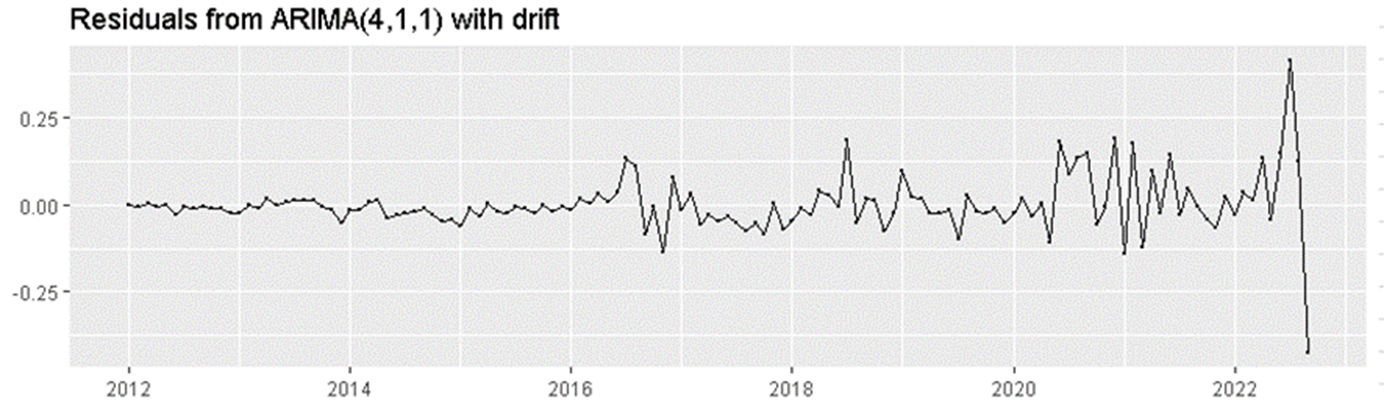
1.1 - Arima model (4,1,1) with drift.
In view of the best ARIMA model found, the Brazilian price series can be explained by its 4 past monthly values (p), with 1 differentiation (d), and its monthly data can be explained by the error of its previous value (q). In this model it was not recognized as timely the entry of the seasonal part (i.e., a SARIMA model). Its residues were also stationary and without autocorrelation (ACF test) that would make it impossible to use the model, as seen in the following graphs:
1.2 - Multiplicative Holt-Winters
The smoothing parameters of the Multiplicative HW model found were: alpha = 0.9984; beta = 0.0578; gamma = 7e-04
Therefore, a high alpha value can be observed, almost approaching 1.0, denoting that strong weight has been attributed to the last months in the projection. This is easily understood by verifying the extensive upward trend that was configured in the months of 2022.
1.3 - Holt-Winters Additive
In turn, the smoothing parameters of the Additive HW model found are as follows: alpha = 0.3381; beta = 0.0423; gamma = 1e-04.
Note that by the additive option, the HW model offers a low value in its alpha to the latest data, prioritizing more past data.
1.4 - Neural Network (4-2-1)
In this model, we identified p = 4 (Incorporation dimension for non-seasonal time series), P = 2 (number of seasonal lags) and size = 1 (number of nodes in the hidden layer).
1.5 - Summary of models of accuracy andcomparison of projections
| Model | RMSE | Mae | MAPE | MASE |
| ARIMA | 0.08097728 | 0.04834734 | 3.130688 | 0.1949879 |
| Mr. H.W. Mult. | 0.09157417 | 0.06376585 | 5.094736 | 0.2571718 |
| HW Additive | 0.1438881 | 0.1056586 | 7.815527 | 0.4261281 |
| Neural Network | 0.05955884 | 0.04045896 | 2.742993 | 0.1631736 |
| COMPARISON OF PROJECTIONS | |||||
| ARIMA | NEURAL NETWORK | ||||
| 2022 | October | R$ 2.56 | 2022 | October | R$ 2.56 |
| November | R$ 2.56 | November | R$ 2.23 | ||
| December | R$ 2.49 | December | R$ 2.06 | ||
| 2023 | January | R$ 2.28 | 2023 | January | R$ 2.03 |
| February | R$ 2.36 | February | R$ 2.13 | ||
| March | R$ 2.63 | March | R$ 2,60 | ||
| April | R$ 2.78 | April | R$ 2.53 | ||
| May | R$ 2.84 | May | R$ 3,90 | ||
| June | R$ 2.94 | June | R$ 3.56 | ||
| July | R$ 3,00 | July | R$ 3.65 | ||
| August | R$ 2.94 | August | R$ 3,66 | ||
| September | R$ 2.85 | September | R$ 3.79 | ||
1.6 - Conclusions:
1. Therefore, it is concluded that the best projection for the next 12 months for the average price of milk in Brazil would be with approaches from the Neural Network model. This one obtained the best result in the 4 tests.
2. It is worth noting, however, that the ARIMA model was the only one that obtained tests that were very close to the results of the neural network in the MAE, MAPE and MASE tests, mainly - which could become a projection option - which denotes values much more conservatives in the future lows and highs of average milk prices. In this case, it could be a projection approach for a scenario with lower volatility in the national/world economy.
3. Both models went through the periods of seasonality of milk prices, keeping prices low until January 2023, according to all previous history, and resuming their rise in sequence in February
4. The Neural Network model was more pronounced in seasonality, with an average price 12.31% lower projected in January 2023 in relation to the price of the projection of the Arima model at the time when the quotation touches its resistance line to re-enter february in a new high period.
5. The projection of the Neural Network remains high until May 2023, re-entering a new phase of projections of commodity losses; the Arima projection maintains its high until July, and then resumes low projections. In the observation of the historical the seasonality pertinent to the beginning of the price drops vary between July and November, so the Arima came closer to reality in this issue.
6. The average price of milk projected for July by the Arima model is 21% higher than the projection of the neural network model for August
2 - Forecast of the Average Price of Milk to the Producer in Santa Catarina
The chart with the forecast of average milk prices in Santa Catarina for the next 12 months addressing four predictive models are presented below:
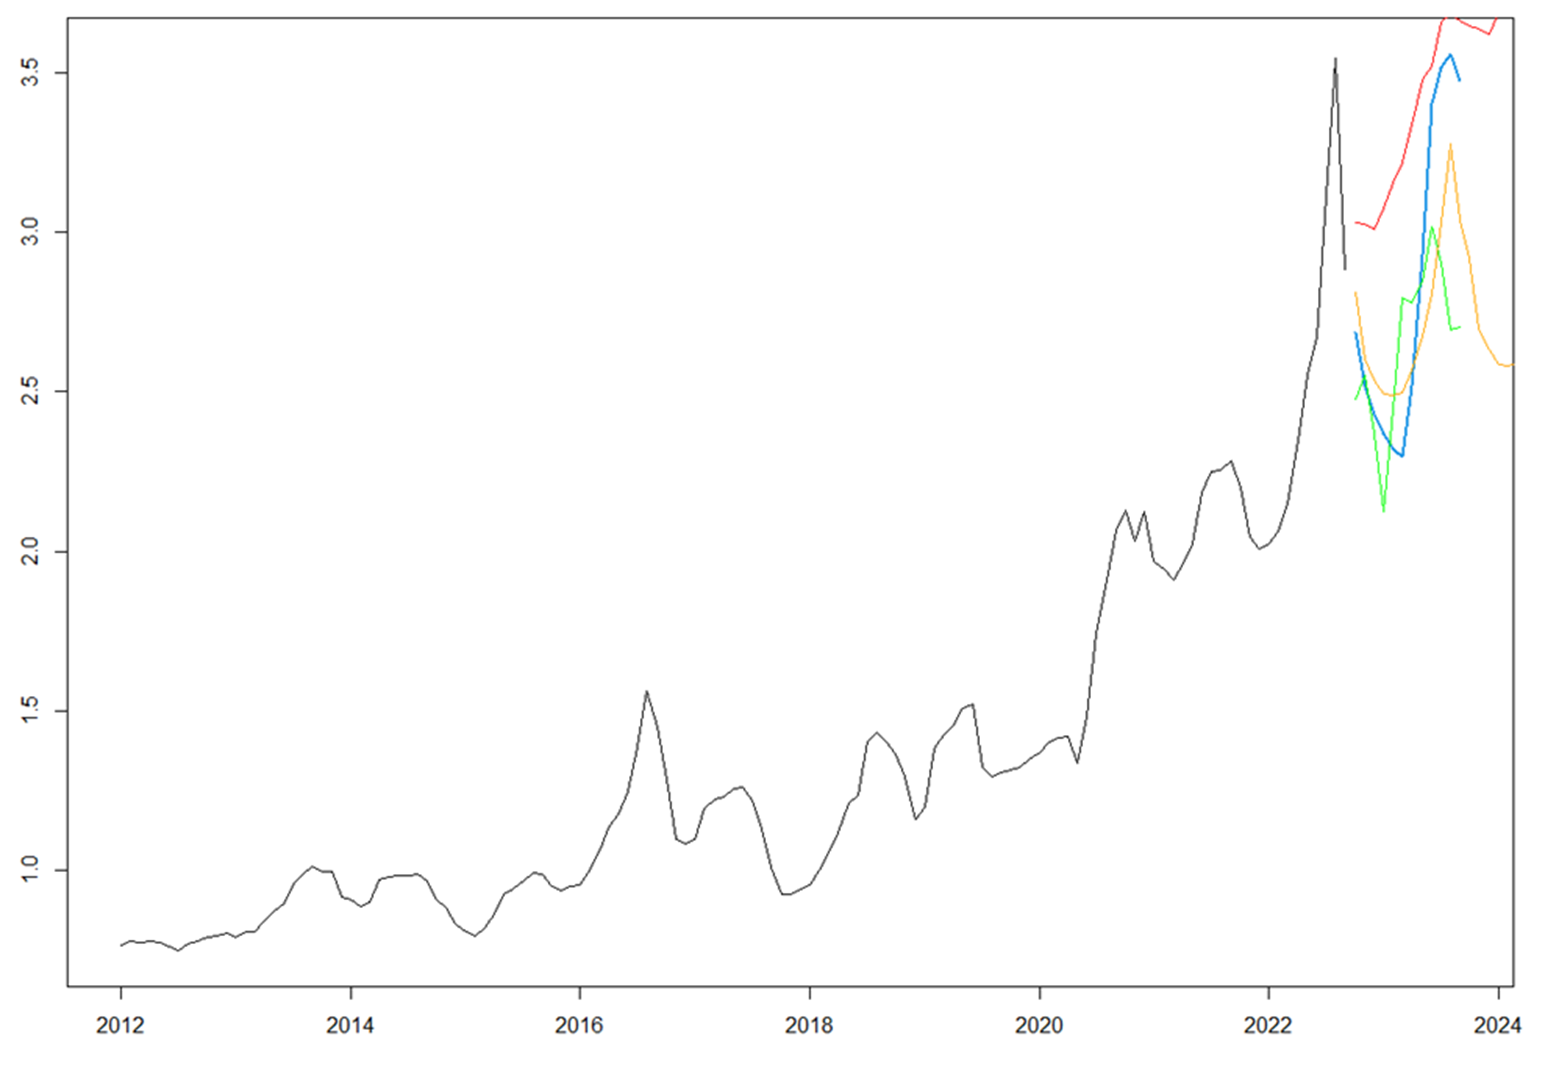
Legend: Blue = Neural Network projection; Red = Holt-Winter Additive Projection; Orange = Multiplicative Holt-Winter projection; Green = Arima projection
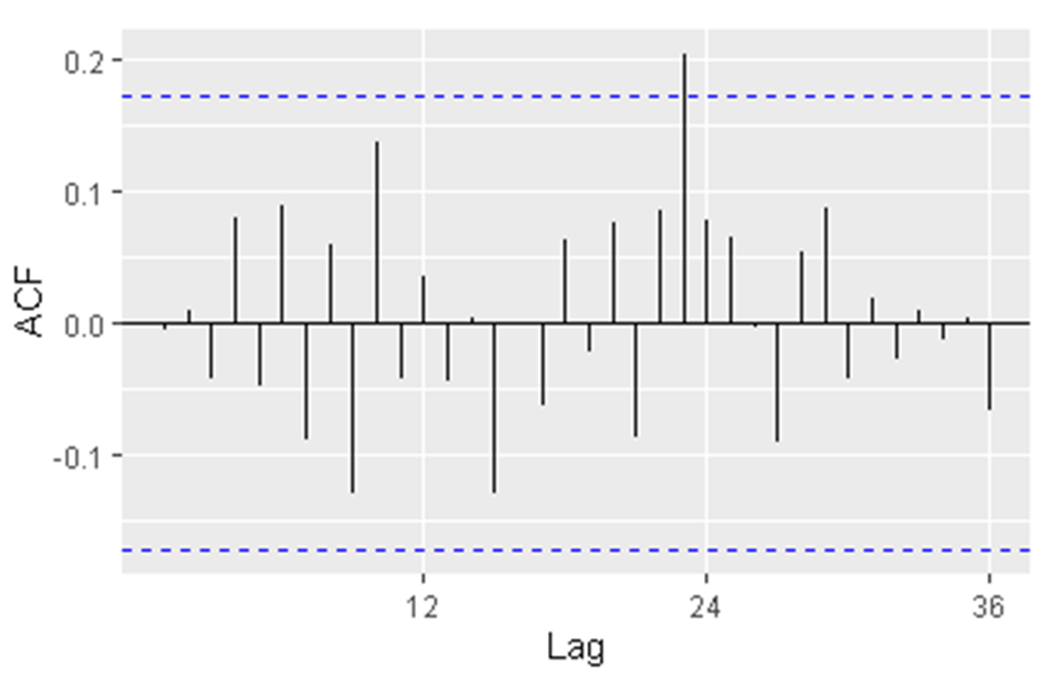
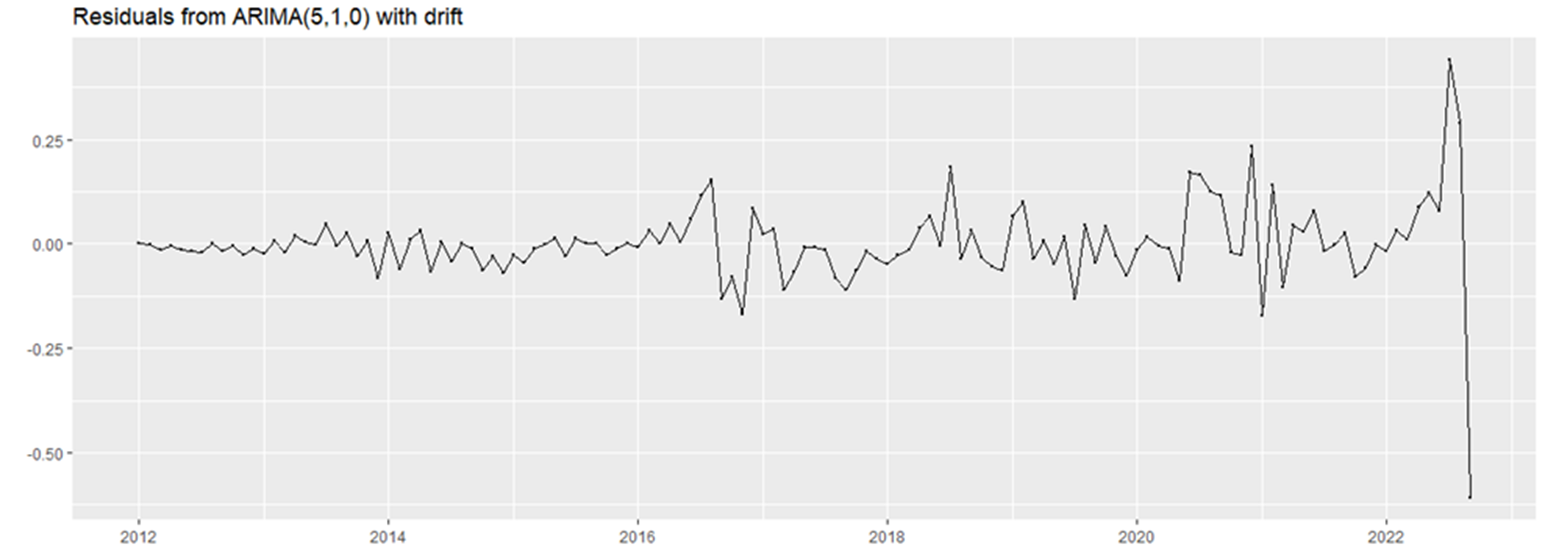
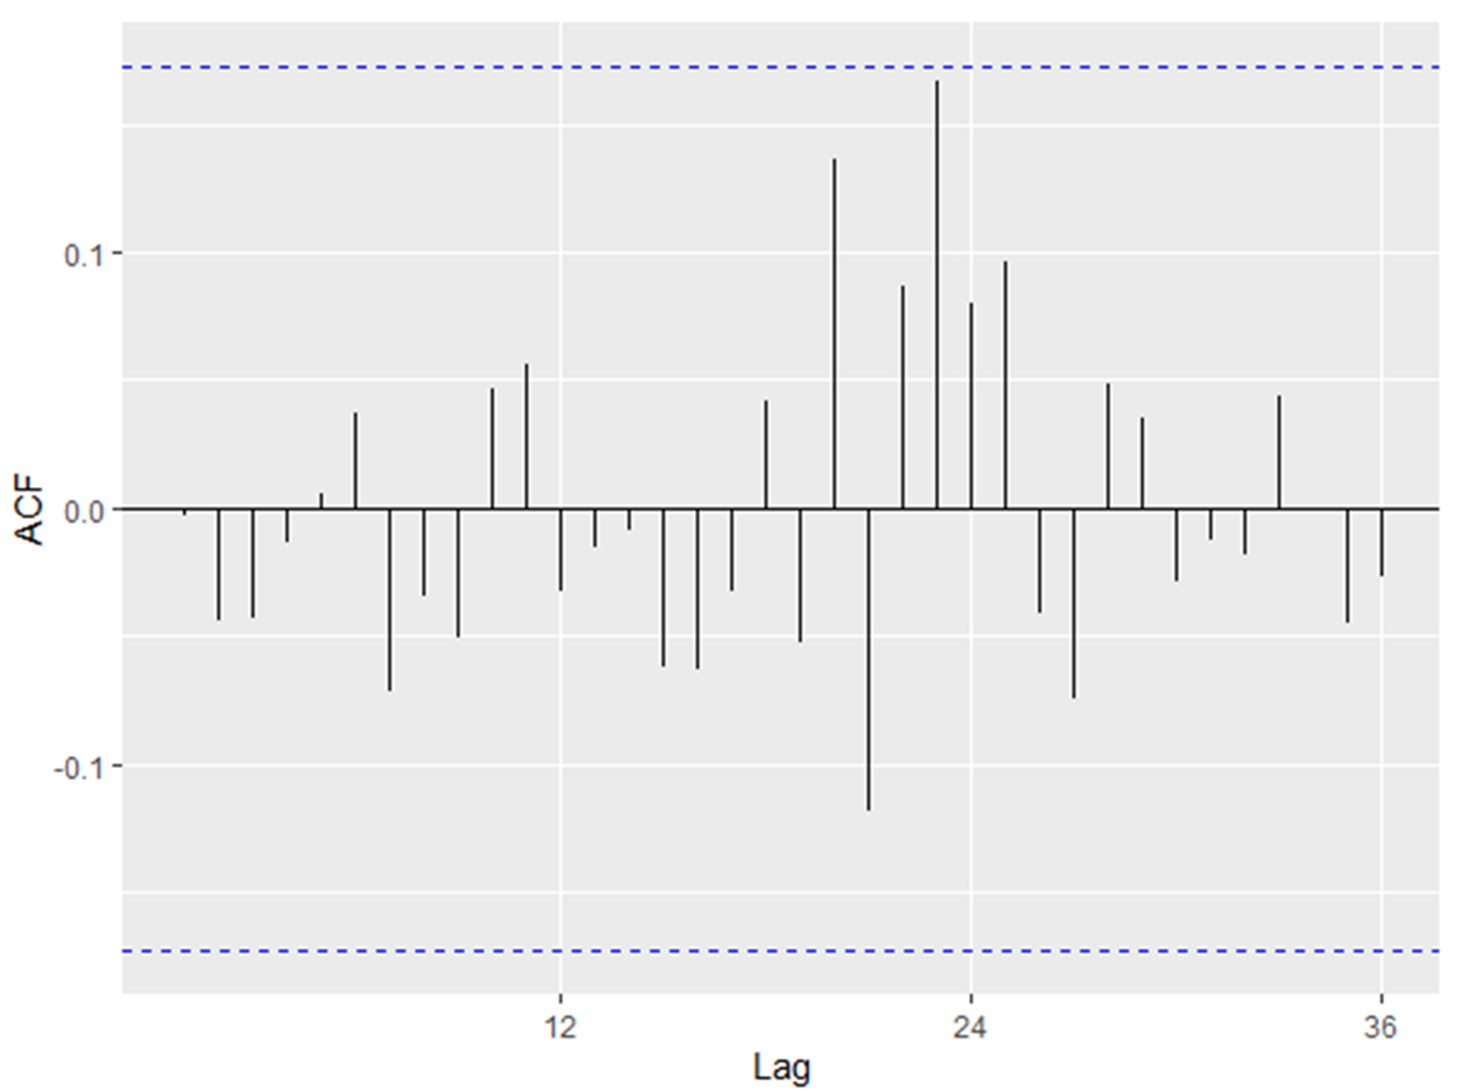
2.1 - Arima (5,1,0) with drift.
As for the ARIMA model found, the Brazilian price series can be explained by its 5 past monthly values (p), with 1 differentiation (d), and its monthly data cannot be explained by the errors of its previous values (q). Again, in this model it was not recognized as timely the entry of the seasonal part (i.e., a SARIMA model). Stationary residuals and no autocorrelation (ACF test) more expressive, as seen in the following graphs:
2.2 - Multiplicative Holt-Winters
The smoothing parameters of the Multiplicative HW model found were: alpha = 0.8811; beta = 1e-04; gamma = 0.0014.
As was the case for this model for average milk prices in Brazil, in CS, more weight was also offered to the most recent price values, but less markedly, with alpha = 0.88.
2.3 - Holt-Winters Additive
Damping parameters: alpha = 0.4759; beta = 0.0255; gamma = 0.002
Again, it follows the damping pattern of average prices in Brazil, now offering greater weight for more past data, but in SC lower damping, with alpha = 0.47.
2.4 - Neural Network (4-2-1)
Identical to sc model with BR. A p = 4 (Incorporation dimension for non-seasonal time series), P = 2 (number of seasonal lags) and size = 1 (number of nodes in the hidden layer) were found.
2.5 - Accuracy of models and comparison of projections
| Model | RMSE | Mae | MAPE | MASE |
| ARIMA | 0.09629 | 0.05554198 | 3.773262 | 0.2301602 |
| Mr. H.W. Mult. | 0.09544908 | 0.06622345 | 5.041962 | 0.2744231 |
| HW Additive | 0.1411771 | 0.1040518 | 8.464072 | 0.43118 |
| Neural Network | 0.08013129 | 0.05231241 | 3.563385 | 0.2167772 |
| COMPARISON OF PROJECTIONS | |||||
| ARIMA | NEURAL NETWORK | ||||
| 2022 | October | R$ 2.47 | 2022 | October | 2,69 |
| November | R$ 2.55 | November | 2,52 | ||
| December | R$ 2.36 | December | 2,43 | ||
| 2023 | January | R$ 2.12 | 2023 | January | 2,37 |
| February | R$ 2.45 | February | 2,32 | ||
| March | R$ 2.79 | March | 2,30 | ||
| April | R$ 2.78 | April | 2,52 | ||
| May | R$ 2.84 | May | 2,93 | ||
| June | R$ 3,02 | June | 3,40 | ||
| July | R$ 2,90 | July | 3,52 | ||
| August | R$ 2.69 | August | 3,56 | ||
| September | R$ 2,70 | September | 3,48 | ||
2.6 - Conclusions
1. Therefore, it is concluded that the best projection for the next 12 months for the average price of milk in the state of Santa Catarina is also based on the Neural Network model. It was the best result in the 4 tests.
2. The ARIMA model was, also in Santa Catarina, the one that incurred in tests with values very close to those of the Neural Network (practically tying in MAE). Therefore, it could become a projection option. This time, on the other hand, the values at the bearish resistance were relatively equivalent.
3. Both models went through the periods of seasonality of milk price, but with the ARIMA model keeping the low until January 2023, while the neural network model kept low until March.
4. The Arima model was slightly more pronounced in seasonality (by verifiing the situation occurred in the average prices of Brazil), with an average price 8.49% lower projected in January 2023 in relation to the price of the projection of the Neural Network model in March.
5. The projection of the Neural Network remains high until August 2023, re-entering a new phase of projections of commodity losses; the Arima projection maintains its high until June, and then resumes low projections. In the observation of the history the seasonality pertinent to the beginning of the price losses in Santa Catarina, alternate between July and November, therefore both are pertinent.
6. The average price of milk projected for August by the Neural Network model is 18.9% higher than the projection of the ARIMA model for the month of June
References:
CEPEA/ESALQ/USP. LEITE AO PRODUTOR CEPEA/ESALQ (R$/LITRO) - LÍQUIDO (2022)
CANAL RURAL. Cresce a concentração na produção de leite em Santa Catarina (2022)
EMBRAPA. Leite e derivados registram queda de preços no mercado (2022)
DIEESE. Custo da cesta aumentou em nove capitais (2022a).
DIEESE. Preços dos produtosIn natura reduzem custo da cesta (2022b).
DIEESE. Custo da cesta básica diminuiu em 16 capitais (2022c)
MAPA. Ministério da Agricultura, Pecuária e Abastecimento (2022)
FREEPIK. Vetores, Fotos de arquivo e downloads PSD grátis (2022)