PIG PRODUCTION IN SANTA CATARINA AND ITS COSTS WITH MAIZE GRAINS AND SOY: A COINTEGRATION BETWEEN THE SERIES OF ITS RETURNS
PIG PRODUCTION IN SANTA CATARINA AND ITS COSTS WITH MAIZE GRAINS AND SOY: A COINTEGRATION BETWEEN THE SERIES OF ITS RETURNS
By Daniel Christian Henrique and João Carlos Prats Ramos (Pibic scholarship holder)
According to the report of the Síntese Anual da Agricultura de Santa Catarina developed by Epagri/Cepa (2021), in 2020 the value of agricultural and livestock production (VPA) in the state obtained a nominal growth of 21% in relation to 2019, reaching the figure of R$ 40.9 billion. Of this total, 23% was related to pork production, followed by 17.5% of chicken production and 12% of milk production. With this growth, the state further consolidates its national leadership in the production of this protein and its presence in international markets ahead of its 35% expansion in exports of this commodity in 2020. In line with this increase, there has also been an increase in pig production costs, accounting for a cumulative increase of 4.78% between January and March 2021. If you add the fact that the cumulative total for 2020 was 48.78%, since the start of the pandemic there is already a total percentage of 53.56%. A significant part of this increase is attributed to the increases in prices of grains that serve as nutrition for pigs, close to 80% of the total cost of their production (EMBRAPA, 2021). The most common grains used in swine nutrition are corn and soybeans. Given that the state of Santa Catarina is the national leader in the production of this protein and its great weight in national agribusiness exports, it is pertinent to analyze the cointegration between the time series of corn, soybeans and pork in order to analyze how impactful these price increases can be. The data were collected at Cepea/Esalq (2021) on a monthly basis for the last ten years (January 2011 to March 2021). Then they were set up in returns via difference in natural logarithms. Johansen's cointegration was the method chosen due to the longer time period and the lack of stationarity of the series at the level, but stationary in first difference. As a last step an error correction vector (VEC) was created in order to investigate the impacts of the increases in corn and soybean costs on pork prices in Santa Catarina. The first possible cointegration analyzed was between the return’s series of corn and pork meat, with the application of Johansen's test. The results showed it is possible to refute the null hypothesis that there is no integration equation, that is, that r = 0 and there is no cointegration, considering the following critical values for the 1%, 5% and 10% significance limits:
| The value of the test statistic Johansen is: 45.6618; Null Hypothesis: r = 0 | ||
| 10pct | 5pct | 1pct |
| 13.75 | 15.67 | 20.20 |
In accordance with the presence of an integration equation between the series, the IRF was applied to the VEC:
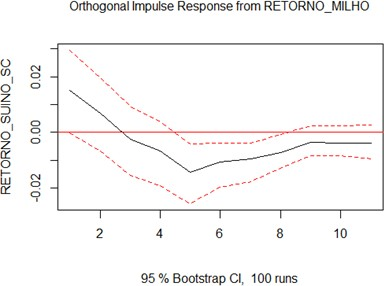
Note that an increase in the price of corn (and its return) raises the price of swine (and return) until almost the end of the third month ahead, then starting a reduction in its price and a return of pork until the fifth month ahead, almost returning to its initial price level close to the ninth future month.
Now taking the returns of soybeans, the same procedures were put in place for the Johansen test:
| The value of the test statistic Johansen is: 48,1321; Null Hypothesis: r = 0 | ||
| 10pct | 5pct | 1pct |
| 13.75 | 15.67 | 20.20 |
It is also possible to observe the refutation of the null hypothesis of the absence of an integrating equation because the critical value of the test is above the mandatory values at 1%, 5% and 10% (it is not a percentage analysis).Therefore, at least one integrating relationship is pertinent between them, as seen in the IRF below:
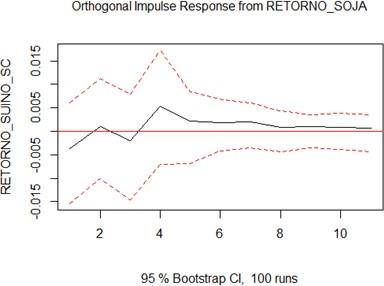
Interestingly, one notices that the rise in soybean returns does not impact pig returns too much, generating even a small but not very significant rise, returning almost to the initial price level after a few months ahead. One possible explanation for the fact that corn incurs falling pig returns and soybeans is not as relevant is a probable integration between the prices of the two types of grains, confirmed below in the cointegration test of their returns in the IRF plot of the VEC:
| The value of the test statistic Johansen is: 38,4359; Null Hypothesis: r = 0 | ||
| 10pct | 5pct | 1pct |
| 13.75 | 15.67 | 20.20 |
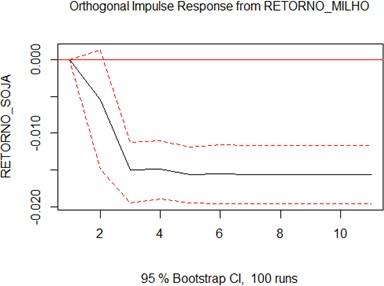
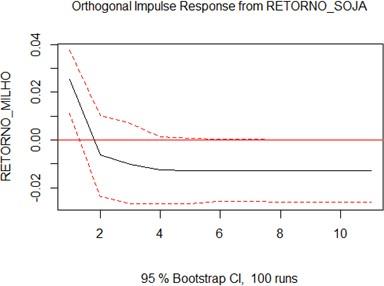
One can clearly see the strong integration among the grains: a rise in the corn returns generates a strong fall until three months ahead in the soybean returns, remaining at this level. On the other hand, a rise in soybean prices raises the price of corn in the next month, but this is followed by a loss of profitability in the following months.
References
EMBRAPA. Embrapa Suínos e Aves. Available in: https://www.embrapa.br/suinos-e-aves/cias/custos/icpsuino. Access in: 16 abr. 2021.
EPAGRI/CEPA. Síntese anual da agricultura de Santa Catarina 2019-2020. Florianópolis: Epagri/Cepa, 2021. Available in: https://docweb.epagri.sc.gov.br/website_cepa/publicacoes/Sintese_2019_20.pdf. Access in: 16 abr. 2021.