Tax and GDP Per Capita Forecasts for Cities in the State of São Paulo in Times of Pandemic
SUMMARY
1 - Fiscal collection forecasts for cities in the state of São Paulo by value added sectorial. By Jucemar Paes Neto and Daniel Christian Henrique
2 - GDP Per Capita forecasts for cities in the state of São Paulo. By Luis Ricardo Mendes da Silva and Daniel Christian Henrique.
1 - FISCAL COLLECTION FORECASTS FOR CITIES IN THE STATE OF SÃO PAULO BY VALUE ADDED SECTORIAL
By Jucemar Paes Neto and Daniel Christian Henrique
São Paulo currently configures the state with the highest tax collection in the country (COORDENAÇÃO-GERAL DE ARRECADAÇÃO E COBRANÇA, 2020), demonstrating the strong production potential of its industry and its services. However, with the new panorama of forecasts for decreasing Brazilian GDP already reaching levels of retraction that reach -6.51% for 2020 (BACEN, 2020), resulting from the crisis brought about by the coronavirus earlier this year, the state will consequently also continue feeling its effects in all its economic activity, impacting the wealth generated in its productive segments. In government management, therefore, an adequate collection forecasting model is essential in this situation to balance future spending and keep the state within the law of fiscal responsibility, since taxation still remains the main means of financing government spending ( MONTOYA, et al., 2011). To meet this purpose, a relationship was made between the Added Value of Agriculture, Industry and Services generated by the cities of the state of São Paulo with their tax collections, in an attempt to ascertain the impact generated by the former in the latter.
Product taxes comprehend municipal (ISS), state (ICMS) and federal (IPI, II, IOF, PIS, COFINS; and other taxes) (COORDENAÇÃO DE CONTAS NACIONAIS, 2016). The data are made available by the SEADE Foundation (2020) by municipality, totaling a data collection in 656 cities in the state of São Paulo, in which the following variables were selected:
• Value Added: Agriculture (Values in thousand Reais for each municipality)
• Added Value: Industry (Values in thousands of Reais for each municipality)
• Added Value: Total Services (Including Public Administration with values in thousand Reais for each municipality)
• Taxes (Values in thousands of Reais)
To meet the proposed objective, a multiple regression was developed in which Taxes (Y) were taken as a response variable, to be explained by the variables that compute the Added Value of: “Industry (X1)”, of “Total Services ( X2) ”and“ Agriculture (X3) ”, with the objective of understanding which of these segments causes major or minor changes in the collection of municipal taxes and making possible collection predictions. As a first approach, a correlation test was carried out between each variable X and variable Y to take into account the relationship between them, observing high values of correlation of taxes with the added values of industry and services and practically zero for that of agriculture.
The Stepwise Backward procedure was adopted for the sequential elimination of explanatory variables that presented multicollinearity. However, this problem was not detected, and all remained as predictors. Outliers resulting from taxes were removed in order not to generate bias in the prediction equation and all variables transformed into a common logarithm (base 10 logarithm).
The forecast equation obtained in the multiple regression analysis was:

A good degree of explanation of data adjustment by the equation was obtained, with an adjusted R² equal to 93.65%, as well as the validity of its equation and its prediction coefficients when providing approvals in the F and T tests for the significance level of 0.05 (see Table 1).
Tests F and t | Coefficients | P-Value | Status |
Model | 2,2 E-16 | Approved | |
Constant | -1,14267 | 2 E-16 | Approved |
Industry | 0,3397 | 2 E-16 | Approved |
Services | 0,80628 | 2 E-16 | Approved |
Agriculture | -0,05308 | 9,94 E-4 | Approved |
Table 1: Results of F and T tests
The histogram and quantile comparison graphs of the residues confirm the compliance with the Normal Law and the pertinence of the developed equation, as well as the approval in the Kolmogorov-Smirnov test, equal to 0.04009.
As expected by the initial correlation tests, the variable X3 (Value Added: Agriculture) has a very low impact on the collection of taxes for the state of São Paulo. This can be explained by the fact that a significant part of the agricultural taxes are not considered in this accounting (ITR, IRPF, FUNRURAL), since it is only taxes on products and not on profits. Regarding the collection of ICMS, its impact has historically been negligible in municipal taxes, not reaching 0.1% of the revenue from this tax. It should be noted that agriculture comprises farming, livestock and other agricultural activities. It is not about agribusiness (total set of activities), which reaches up to 23% of the total ICMS. This percentage increase is explained by the taxation system, in which there is a transfer of the ICMS payment for agricultural products to the agribusiness buyer. Another factor that contributes to this low representation of agriculture is the tax evasion in the sector. This tax evasion is more accentuated in less formal activities, but in export activities that are highly supervised, there is no ICMS taxation (BRUGNARO, DEL BEL FILHO and BACHA, 2003). Montoya et al. (2011) still conclude that the agribusiness sector aggregates that process and distribute add value to the field's raw materials and are the most profitable to the tax authorities.
In the equation, it is noted that the coefficient of services (0.80628) is, in turn, much more expressive than that generated by the industry (0.3397), indicating that a simulation of reduction in equal percentage for both variables, separately , with the continuation of the pandemic for the next year, it perceives more expressive decreases of taxes by the first variable. It should be noted that for the simulation it is necessary to allocate the values of X in logarithm and after the generation of the equation, it is necessary to transform the predicted values obtained to use the values in Reais, since the values in log10 are only representative of the data.
BACEN offers projections for various market expectations for the next two years to come. GDP is included in these estimates, segregating it into sectoral GDPs projected at added value, making it possible to use the equation developed to prescribe collections for the end of the year 2020 and 2021.
GDP | 2020 % variation | 2021 % variation |
Agriculture | 2,13 | 2,85 |
Services | -5,34 | 3,15 |
Industrial | -6,82 | 4,41 |
Source: BACEN (2020)
Applying the percentage changes projected for the increases or declines of the explanatory variables each year in the forecast equation created, finally, the following predicted tax collection values can be reached:
Year of tax collection | Collection increase or decrease in relation to the base year 2018 |
2020 | -7,20% |
2021 | 3,37% |
For the year 2020, the expected drop in tax collection of -7.20% in taxes follows a level relatively close to those of the services and industrial sectors. As reported, the low participation of agriculture in the collection allowed that its projection of a 2.13% increase in its added value would not have any effect on the increase in collection. The IPEA (2020) has highlighted the positive performance of this sector in the face of the recession scenario caused by the covid-19, only with the beef markets suffering greater percentage reductions, due to its higher price compared to other proteins, as well as the sugar market, affected by the reduction in oil prices and, consequently, alcohol.
The projection period for 2021 is more optimistic from the perspective of the Central Bank, allowing growth variations ranging between 2.85% and 4.41% for the three sectors. Notably, they prescribe a slightly stronger recovery, counting on a vigorous stagnation of the coronavirus in the national and even international field if the accounting of the exports necessary to enter these levels of growth is taken into account. Consequently, an already pre-reactivated economy will allow more tax collections. The inclusion of Bacen's projections in the forecast equation translated this scenario pointing to a 3.37% increase in revenue in 2021 compared to the base year of 2018.
References:
BACEN. Banco Central do Brasil. Available in: https://www.bcb.gov.br/. Access in: 10 de maio de 2020.
BRUGNARO, R.; DEL BEL FILHO, E. e BACHA, C.J.C. Avaliação da sonegação de impostos na agropecuária brasileira. Agric. São Paulo. SP. n. 50. v. 2, p. 15 – 27, 2003.
COORDENAÇÃO-GERAL DE ARRECADAÇÃO E COBRANÇA. Receita Federal (org.). Arrecadação UF jan-dez 2019. 2020. Available in: https://receita.economia.gov.br/dados/receitadata/arrecadacao/arrecadacao-por-estado/arrecadacao-uf-2019/arrecadacao-por-uf-internet-jan-a-dez19.ods/view. Access in: 11 maio 2020.
COORDENAÇÃO DE CONTAS NACIONAIS. IBGE. Produto interno bruto dos municípios: Rio de Janeiro, 2016. 58 slides, color. Available in: https://www.seade.gov.br/produtos/midia/2016/05/liv97483.pdf. Access in: 11 maio 2020.
IPEA. Instituto de Pesquisa Econômica e Aplicada: Carta de Conjuntura. Available in: http://www.ipea.gov.br/cartadeconjuntura/index.php/category/agropecuaria/. Access in: 12 mai. 2020.
MONTOYA, M. C.; FINAMORE, E. B.; PASQUAL, C. A.; BOGONI, N. M. Evolução do custo da carga tributária no agronegócio e na economia gaúcha: uma análise insumo-produto dos impostos indiretos. Congresso Brasileiro de Custos, 18, Rio de Janeiro. Evolução do custo da carga tributária no agronegócio e na economia gaúcha: uma análise insumo-produto dos impostos indiretos. Rio de Janeiro: Anais, 2011.
SEADE. Fundação Sistema Estadual de Análise de Dados. Portal Estatísticas do Estado de São Paulo. Available in: https://www.seade.gov.br/. Access in: 10 de maio de 2020.
2 - GDP PER CAPITA FORECASTS FOR CITIES IN THE STATE OF SÃO PAULO
By Luis Ricardo Mendes da Silva and Daniel Christian Henrique.
São Paulo is an extremely important state in the Brazilian economy, ranked as the most populous and with the highest GDP (Gross Domestic Product) in the country. In 2017 it totaled more than 45 million inhabitants, accounting for a GDP of R $ 2.09 trillion (IBGE, 2020; SEADE, 2020). According to the IBGE, GDP represents the sum of all final goods and services produced by a country, state or city during a given period. In addition, GDP per Capita (division of GDP by number of inhabitants) can be analyzed, resulting in R $ 46,412.30 per inhabitant in the state of São Paulo, also in 2017. This indicator provides a view that assists representatives and agents in their decision-making in favor of the population. Therefore, a São Paulo GDP predictive equation was developed to better fit the necessary adjustments and actions for a more vigorous recovery of the regional economy during and after the coronavirus pandemic period.
In IBGE (2020) and SEADE (2020), some collection data and indicators were collected from all 645 municipalities in the state of São Paulo, with the objective of identifying their impacts on GDP per capita in each city. Because they are two different bases, the use of 2017 data was requested to enable the adoption of all proposed variables to be analyzed. To achieve the objective, a multiple regression was then performed, allocating GDP per capita (Y) as a response variable, to be explained by the other data and indicators:
• Total realized revenue (X1),
• Infant mortality (X2),
• HDI (X3),
• Expenses performed (X4),
• Average monthly salary of formal workers (X5),
• Industry added value (X6),
• Agricultural added value (X7),
• Value added Services (X8).
The procedure used was Stepwise Backward Multiple Regression, which performs sequential elimination of variables that show multicollinearity. All variables were transformed into a common logarithm (base 10 logarithm), as a way of smoothing the data and certifying its normality. When applying the adopted procedure, the variable X1 (Total realized revenue) was eliminated. The prediction equation obtained was:
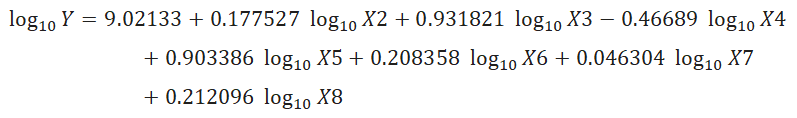
An adjusted R² of 64.63% was reached, showing a good degree of explanation of the adjustment of the data by the predicted equation. It was additively validated by the F and T tests that presented approval for the 0.05 significance level:
Teste F e T | Coeficientes | Valor-p | Situação |
Modelo | 2.2e-16 | Approved | |
Constante | 9.02133 | 2e-16 | Approved |
X2 | 0.177527 | 7.67e-13 | Approved |
X3 | 0.931821 | 0.0151 | Approved |
X4 | -0.46689 | 2e-16 | Approved |
X5 | 0.903386 | 2e-16 | Approved |
X6 | 0.208358 | 2e-16 | Approved |
X7 | 0.046304 | 2.34e-06 | Approved |
X8 | 0.212096 | 5.86e-09 | Approved |
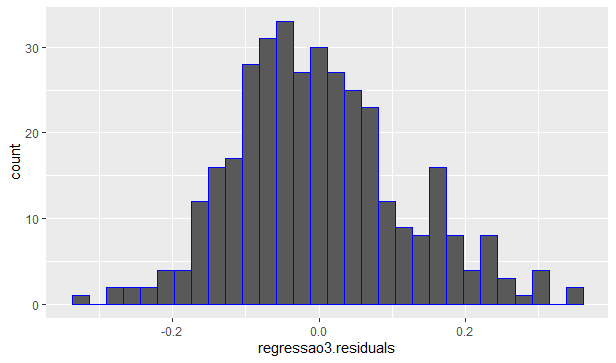
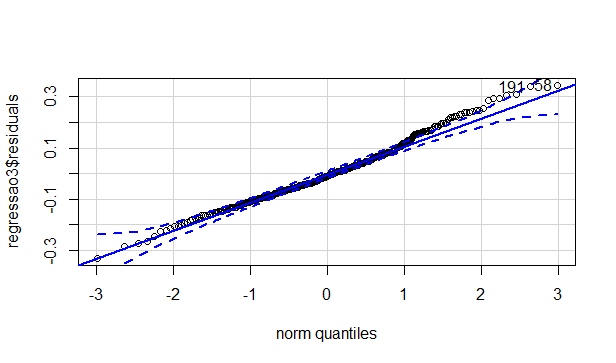
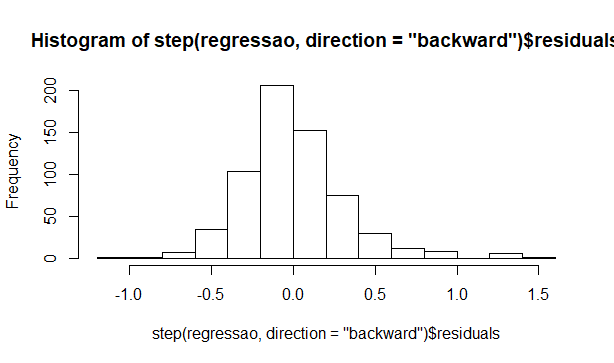
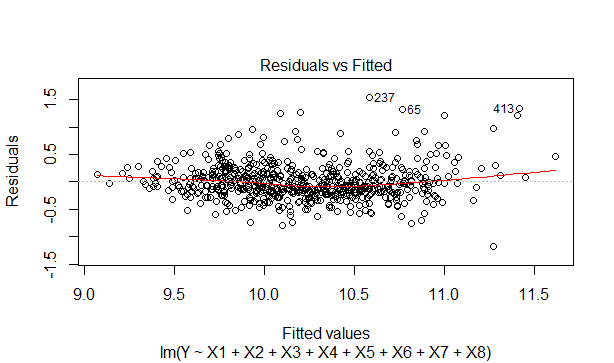
The histogram of the residues together with the dispersion graph of the residues x predicted values indicate a good disposition to the normality of the data, being sufficient for the proposed analyzes.
Observing the prediction equation, it can be seen that the variable X4 (Expenses performed) has a high negative impact on the GDP per capita, reducing its value by R $ 0.46 for each R $ 1.00 spent on expenses, keeping the others constant variables.
However, it is worth noting that such expenses include salaries of government employees, expenditure on inputs, purchase of land, real estate and investments in works, expenses that most often serve to improve, expand and maintain government structures that provide services to the population. , consequently raising the quality of life in the state to some extent.
X3 (HDI) and X5 (Average monthly salary) can also be perceived as factors of great impact on the GDP per capita of cities in the state. Increases of 1 unit in the HDI or R $ 1.00 in the average salary contribute to an increase in GDP per capita of R $ 0.93 and R $ 0.90, respectively, with everything else being equal. The average monthly salary is expected to be higher, the more well structured and developed the industry, agriculture or the service sector of a given city. But it is notable in the state of São Paulo that the rise in salary also contributes in the opposite direction, raising production per inhabitant in an almost proportional way, forming a cycle of regional growth. On the other hand, the HDI is calculated taking into account the tripod health, education and income with similar weights, becoming more expressive the better the income, health and education of a city. Therefore, health and education are as important as income, in the composition of an HDI, as well as an expressive GDP per capita.
The rest is also interesting to note that the impact of X7 (Value added for agriculture) compared to X6 and X8 (Value added for industry and services respectively) is much smaller, even though the state is the largest producer of orange and orange juice in the world. a very strong production of sugar cane and with good representation in national agriculture. This is because agribusiness, which generates most of the GDP produced by the sector, is not accounted for in this regard. The São Paulo industry, as a whole, increases R $ 0.208 for each unit of its added value. The services, in turn, incur a practically equivalent value in the individual production of its inhabitants, equal to R $ 0.212.
References
BACEN. Banco Central do Brasil. Available in: https://www.bcb.gov.br/content/focus/focus/R20200703.pdf. Access in: 05 de julho de 2020.
FAZENDA E PLANEJAMENTO. Portal da Secretaria da Fazenda e Planejamento do Estado de São Paulo. Available in: https://www10.fazenda.sp.gov.br/DIPAM/ConsultaIndice/DipamFiltroConsultaIndice.aspx. Access in: 08 de abril de 2020.
GOVERNO DE SÃO PAULO. Portal do Governo do Estado de São Paulo. Available in: https://www.saopaulo.sp.gov.br/spnoticias/estado-mantem-setor-de-producao-de-laranja-ativo-para-atender-demanda-pela-fruta/#:~:text=O%20Estado%20de%20S%C3%A3o%20Paulo,cerca%20de%2013%20mil%20toneladas.. Acesso em: 05 de julho de 2020.
IBGE. Instituto Brasileiro de Geografia e Estatística. Portal Cidades. Available in: https://cidades.ibge.gov.br. Access in: 07 de abril de 2020.
SEADE. Fundação Sistema Estadual de Análise de Dados. Portal de Estatísticas do Estado de São Paulo. Available in: http://www.seade.gov.br. Access in: 08 de abril de 2020.