IPVA forecasts for Rio Grande do Sul
By Jucemar Paes Neto e Daniel Christian Henrique
The taxes included at the state level according to article 155 of the federal constitution (BRASIL, 1988) refer to the transmission of causa mortis and donation (ITCD), operations related to the circulation of goods (ICMS) and ownership of motor vehicles (IPVA). Of these, the most significant is the ICMS, which in 2019 corresponded to 90% of the taxes in the state of Rio Grande do Sul (see Figure 1). However, the IPVA, despite having a lower representation in relation to the total of taxes, collected R $ 3 billion in the same year (RECEITA-DADOS, 2020).
Graph 1 - Taxes paid in Rio Grande do Sul in 2019
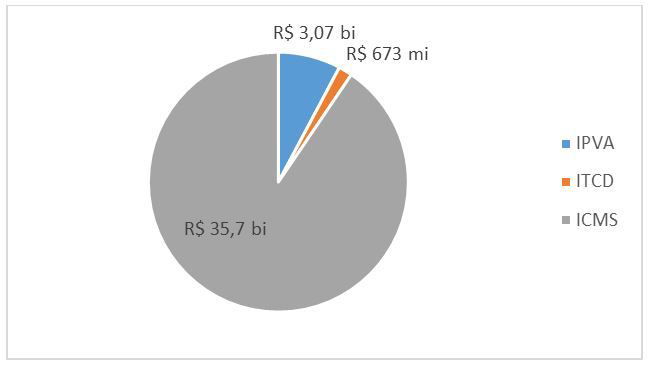
Source: RECEITA-DADOS (2020)
In Rio Grande do Sul, a fleet of 7,034,398 is currently in circulation (DETRAN-RS, 2020). In this there is an incidence of IPVA in 55% of the fleet, the rest being exempted by the law 8,115 (official vehicle, taxi, disabled person, bus, school transport, churches, among others). The rate applied is 3% for motor vehicles of the automobile or pickup type, 2% for motorcycles and 1% for trucks and other vehicles for rental (LEI No. 8,115, 2020). Among the total collected, 50% goes to the State and the remaining 50% goes to the municipalities in which vehicles were taxed. Of the total of this last collection, 20% goes to FUNDEB - Fund for the Maintenance and Development of Basic Education and the Valorization of Education Professionals for the development of the educational sector (CÂMARA DOS DEPUTADOS, 2020). Other allocations can still be made to these resources: health, traffic, safety, in accordance with the needs of each state.
According to FENAUTO (2020), since the beginning of the quarantine, vehicle sales have been falling, with a decrease of 65.2% in May sales compared to last year. In the continuum of this scenario is the question of how much this reduction in the future fleet may perceive changes in the collection of IPVA for the state. For this purpose, the IPVA variable was allocated as a response variable (Y) to be explained by the others (Xn) chosen as potential predictors, in order to analyze which of the latter could increase or reduce the collection of this tax due to the impact that the pandemic of the coronavirus permeated vehicle sales this year.
The information was obtained from the open data provided by the government of Rio Grande do Sul (DADOS RS, 2020), accounting for a collection in 497 municipalities in the relevant state the following variables:
- IPVA (in R$)
- Distance to Porto Alegre (in km)
- Vehicles by kind of fuel: Alcohol (in units)
- Vehicles by kind of fuel: Gasoline (in units)
- Vehicles by kind of fuel: Diesel (in units)
- Vehicles by kind of fuel: Flex (in units)
- Vehicles by kind of fuel: Outros (in units)
- Vehicles by class: Load (in units)
- Vehicles by class: Passengers (in units)
- Vehicles by class: Outros (in units)
- Vehicles Total (in units)
- Municipal GDP (in thousands of R$)
- State Taxes (in R$)
- Federal Taxes (in R$)
Multiple regression was performed using the Stepwise Backward tool to eliminate variables that showed multicollinearity, removing the variables “Federal Taxes”, “GDP”, “Vehicles powered by alcohol” and “distance to Porto Alegre”. Only the variables related to the number of vehicles with explanatory power to the future variation in the collection of IPVA in the state remained. Procedures for removing outliers with the group and transforming them into a natural logarithm to normalize the data were adopted to finally find the forecast equation shown below:

In which:
X1 : quantity of diesel vehicles in circulation;
X2 : quantity of gas vehicles in circulation;
X3 : quantity of Flex vehicles in circulation;
X4 : quantity of vehicles other fuels in circulation;
X5 : quantity of passenger vehicles in circulation;
X6 : quantity of vehicles for other uses in circulation;
X7: state taxes.
The degree of explanation of the equation obtained by the coefficient of determination of the equation was equal to 97.85%, giving a high degree of explanation to the predictions. The equation was approved in the F test with a significance of α = 0.05 as well as the β coefficients were approved in the t test, as summarized in Table 1:
Table 1: Tests of the equation coefficients
Tests F and T | Coefficients | P-Value | Status |
Model | < 2,2 E-16 | Approved | |
Constant | 7,189166 | < 2 E-16 | Approved |
X1 | 0,230051 | < 2 E-16 | Approved |
X2 | 0,311060 | 0,04590 | Approved |
X3 | 0,827536 | < 2 E-16 | Approved |
X4 | 0,020189 | 0,03195 | Approved |
X5 | -0,484492 | 0,01191 | Approved |
X6 | 0,136192 | 7,66 E-7 | Approved |
X7 | 0,022724 | 0,00112 | Approved |
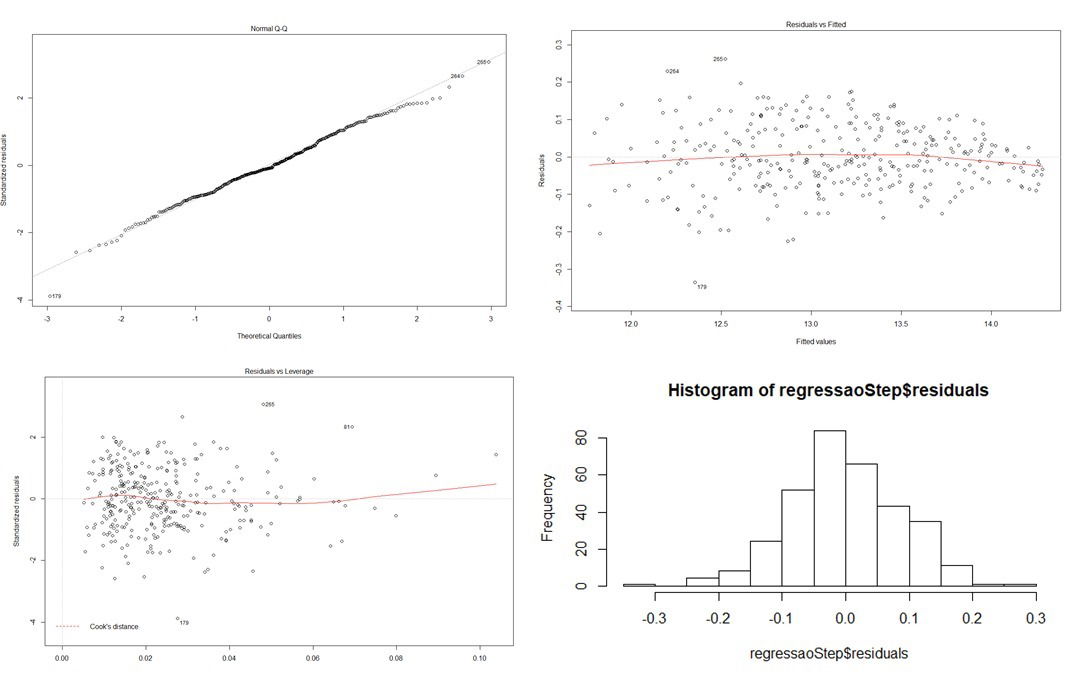
The residuals of the forecast formula in relation to the data passed the normality tests Shapiro-Wilk (p-value = 0.3046) and Kolmogorov-Smirnov (p-value = 0.08939) taking α = 0.05. The normal behavior of the residues can also be observed through the graphs of the residues, histogram, quantile comparison and heteroscedasticity:
Graph 2: Graphic layout of the residues
It can be seen that the variable that has the greatest positive impact on the IPVA is the number of Flex vehicles, reaching a beta of 0.83. This means that the addition of 1 more flex car in circulation in the state, increases the collection of this tax by R $ 0.83. This high value is due to the fact that the vehicle fleet in Brazil is mostly flex fuel, composed of modern models that pay IPVA, since vehicles manufactured more than 20 years ago do not pay it in the State (LEI No. 8.115, 2020).
In the opposite direction, vehicles powered by other types of fuel not composed of gasoline, alcohol, flex or diesel, expand the collection very little with possible increases in circulation, understood by its low volume on the streets of the state.
Another point that deserves attention comes from passenger vehicles (collective) negatively impacting the tax. This is due to the exemption from payment of IPVA to owners of vehicles for transporting passengers in the rental and bus category active in the collective displacement of the community on urban, suburban lines, between municipalities in the same metropolitan region, among other specificities (LEI No. 8,115, 2020).
Once the stage of defining the forecast equation has been completed, the intention is to project the payment of the IPVA against the current reduction in vehicle sales for this year 2020 and for the year 2021. In Rio Grande do Sul, the amount of vehicles in circulation had been growing linearly at an average of 4.56% per year (DETRAN-RS, 2020), almost without oscillation from 2007 until the pre-pandemic period, as can still be seen in the IBGE data for some types of conduct:
Graph 3: Time series of the evolution of RS (Rio Grande do Sul) fleets
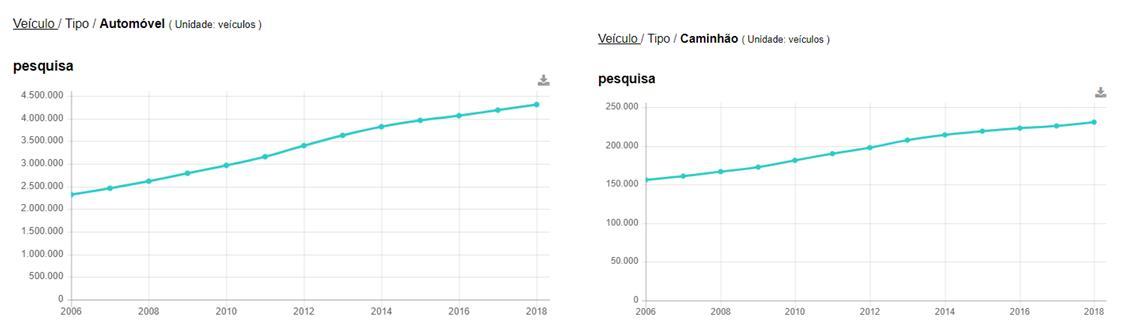
Source: IBGE (2020)
However, the sharpest reduction in fleet growth that occurred in the last months of 2020 does not make it possible to project using a linear equation, requiring a trend damping to be applied, using an exponential projection with phi = 0.9, 0.8 or 0.7. All the projections were tested and the phi = 0.9 was more consistent with the regression of the fleet in the months of 2020 that the pandemic expanded. It is worth mentioning that the drastic drop in production and sales that occurred in the last months of the first semester is not enough to overturn the linear trend line that has been in place since 2006, as cars in circulation will continue to pay IPVA. However, the trend will now follow in a more tenuous way, justifying the need to apply damping. Thus, it is possible to predict in advance that the projection for the end of 2020 will not experience drastic changes in the collection, but the forecasts for 2021.
Below are graphs of the evolution of the fleet of vehicles for Diesel, Flex, Gasoline and Other Purposes (IBGE, 2020) showing in the red highlight the beginning of the slope that each type of fleet started in recent months, leaving its trend almost entirely linear (dotted) that had been drawing up to the pre-pandemic period.
Graph 4: Changes in the trend of the RS fleet
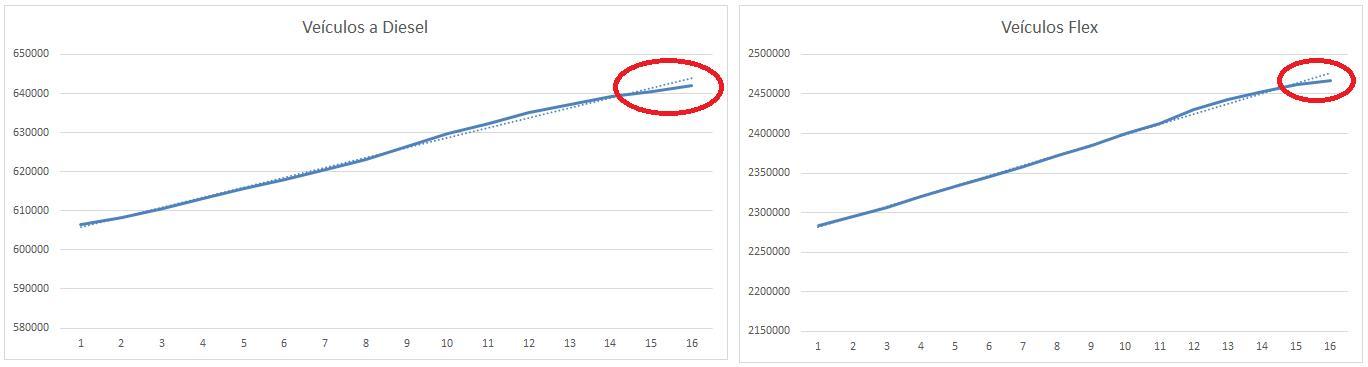
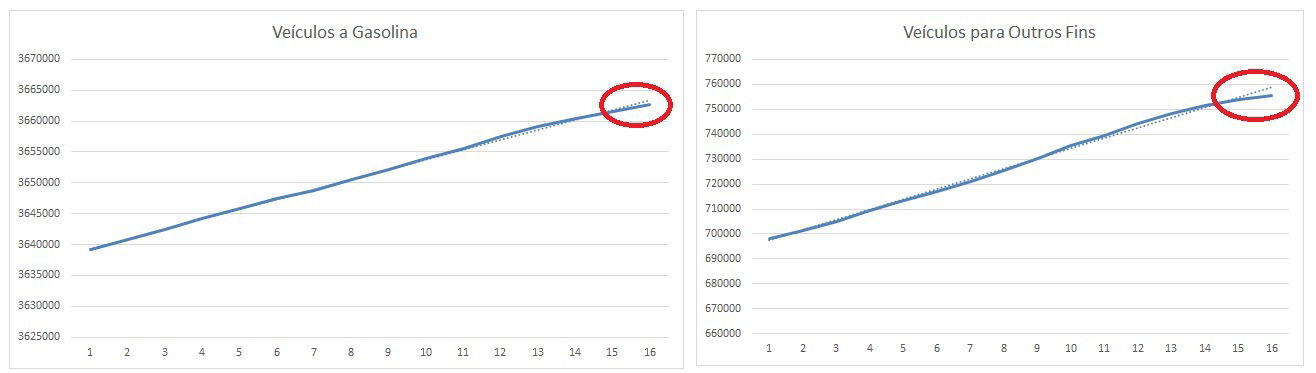
Fonte: DADOS-RS (2020)
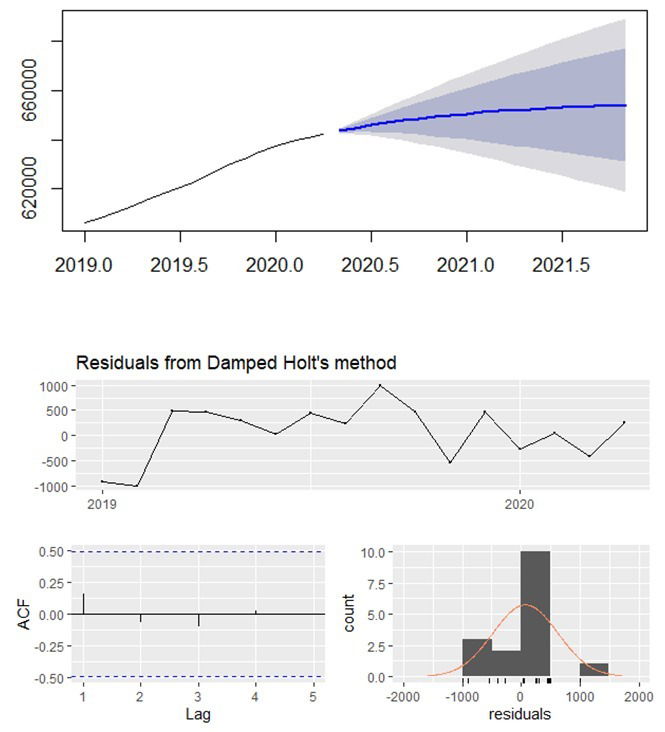
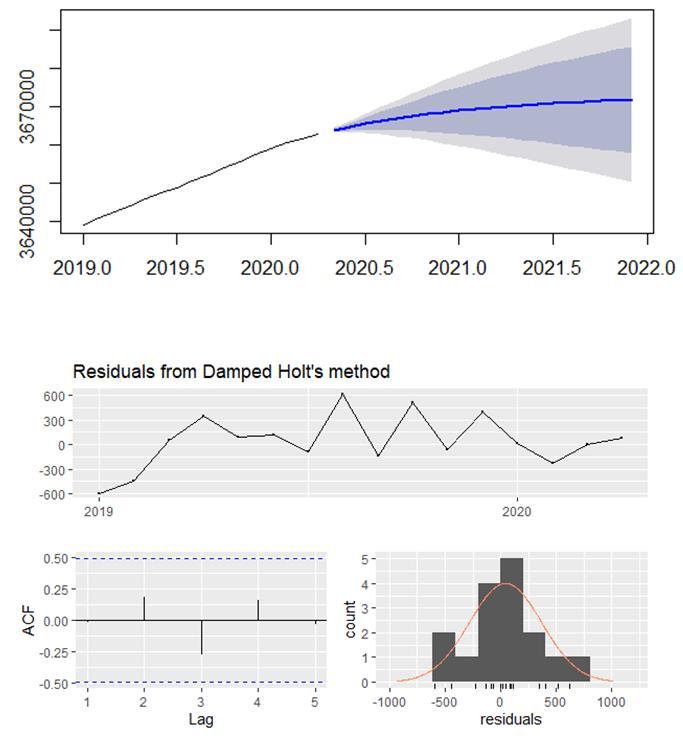
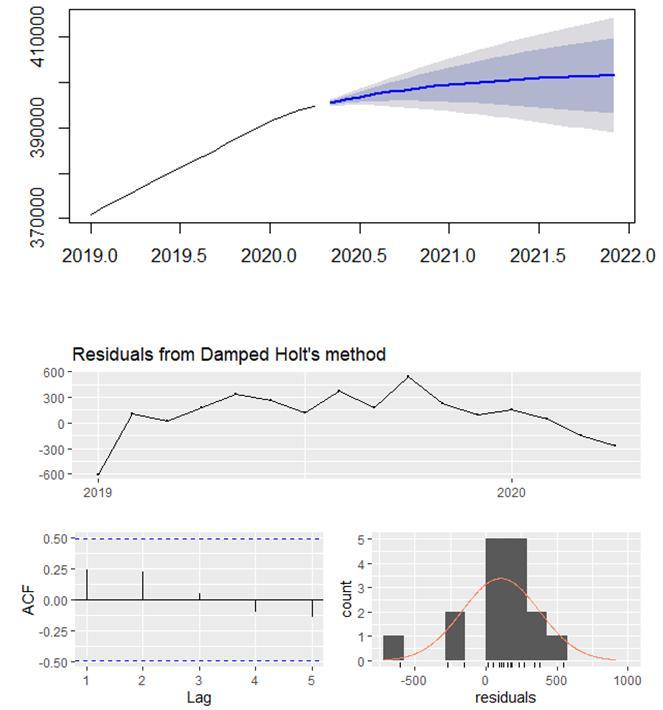
In sequence, the graphs can already be seen with the projections for the next two years. Only the posting of the graphs of the variables with the most relevant coefficients in the equation was prioritized. Additionally, the Ljung-Box tests for residues have already been imputed, to prove errors in white noise, together with the ACF graph, which confirm the absence of auto-correlation between the lags. Confidence levels of 80% and 95% can still be observed in the highlighted areas of the projections, if working with projections in different scenarios:
Graph 5: Diesel vehicles. P-value Ljung-Box = 0.05141
Graph 6: Gasoline vehicles. P-value Ljung-Box = 0.2204
Graph 7: Flex vehicles. P-value Ljung-Box = 0.05316
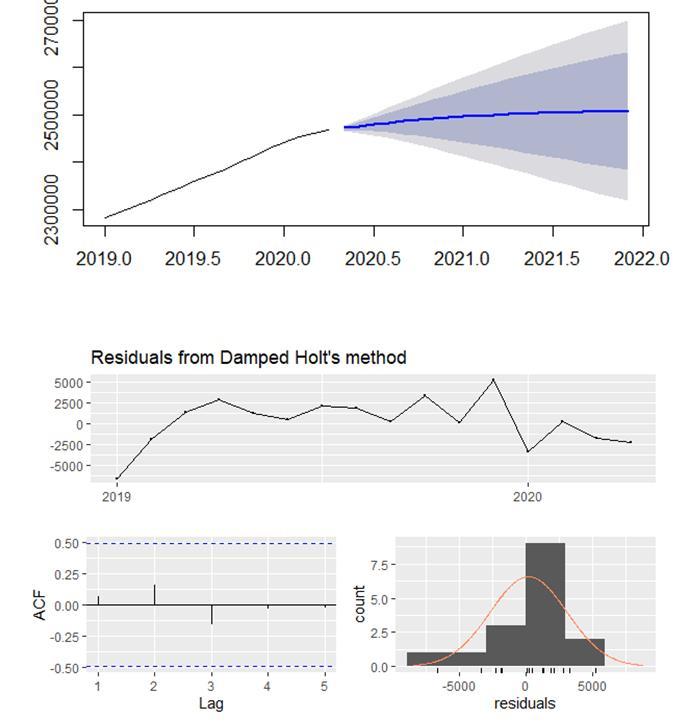
Graph 8: Other Fuel Vehicles. P-value Ljung-Box = 0.07281
Other variables:
Table 2: Results of the Ljung-Box Test for the other variables
Variable X: | P-value Ljung-Box |
Passenger Vehicles | 0,1654 |
Other uses Vehicles | 0,05623 |
State Taxes | 0,1816 |
Finally, with the projected data, it was possible to get at the following forecasts of the annual percentage variation of each fleet and of the other variables of the equation until the months of December of the years 2020 and 2021:
Table 3: Forecasted Fleet Percentage Change
Variable | 2020 | 2021 |
Diesel Vehicles | 2,32% | 0,65% |
Gas Vehicles | 0,30% | 0,09% |
Flex Vehicles | 2,59% | 0,58% |
Other Fuels | 2,37% | 0,61% |
Passengers | 1,16% | 0,27% |
Other uses | 2,79% | 0,69% |
State Taxes | -19,35% | -0,15% |
By allocating the percentages to the predictive equation developed, the following IPVA tax collection forecasts are arrived at for both years:
Table 4: Estimated Percentage Change in IPVA Collection
IPVA | 2020 | 2021 |
Percentage of increase / decrease | 18,67% | 6,31% |
As the vehicle fleet of the state had been rising for more than a decade together with the consequent increase in tax collection, the year 2020 will still not feel the loss of collection more sharply, maintaining an increase that reached the level of 18%, even with the reduction in some percentages in each type of vehicle in the fleet. However, if more favorable sales measures are not taken for 2021, the projected damping in growth predicts that there will still be an increase in revenue, but falling 2/3 of the growth value in relation to 2020. Taking into account the importance that these resources have for education , health and other basic needs of the population, the expected reduction in its collection may require the planning of the public administration to fill this absence, which has become even more vital in these pandemic periods.
References
CÂMARA DOS DEPUTADOS. Impostos que compõem o Fundeb. Available in: https://www.camara.leg.br/noticias/78902-impostos-que-compoem-o-fundeb/. Access in: 30 nov. 2020.
DADOS RS. 2020. Available in: https://dados.rs.gov.br/organization/fundacao-de-economia-e-estatistica. Access in: 20 maio 2020.
BRASIL. [Constituição (1988)]. Constituição da República Federativa do Brasil de 1988. Brasília, DF: Presidência da República. Available in: http://www.planalto.gov.br/ccivil_03/constituicao/constituicao.htm. Access in: 27 maio 2020.
IBGE. Brasil / Rio Grande do Sul. Available in: https://cidades.ibge.gov.br/brasil/rs/pesquisa/22/28120?indicador=28122&tipo=grafico. Access in: 30 jun. 2020.
LEI Nº8.115. Institui o Imposto sobre Propriedade de Veículos Automotores. 1985. Available in: http://www.legislacao.sefaz.rs.gov.br/Site/Document.aspx?inpKey=109693&inpCodDispositive=3584025 Access in: 30 dez. 2020.
FENAUTO. Federação Nacional das Associações dos Revendedores de Veículos Automotores. Available in: http://www.fenauto.org.br/index.php?view=single&post_id=720 Access in: 30 jun. 2020.
RECEITA-DADOS. 2020. Receita Estadual do Rio Grande do Sul. Available in: http://dados.receita.fazenda.rs.gov.br/. Access in: 27 maio 2020.