Fuel prices x sales: an integrated analysis between gasoline, ethanol and diesel for the State of Santa Catarina
In continuity with the posts of scientific reports on fuels, which are afflicting the financial life of Brazilians with their constant highs and consequently reflecting on the prices of products, the integrated relationship between fuel prices at resale stations and their sales in cubic meters has now been analyzed. Therefore, this survey aims to answer questions such as: does the increase in the price of a certain type of fuel decrease your sales? or increases of another kind? or do they both diminish? The opposite is also worth analysing: can increases or decreases in sales affect your interrelated prices?
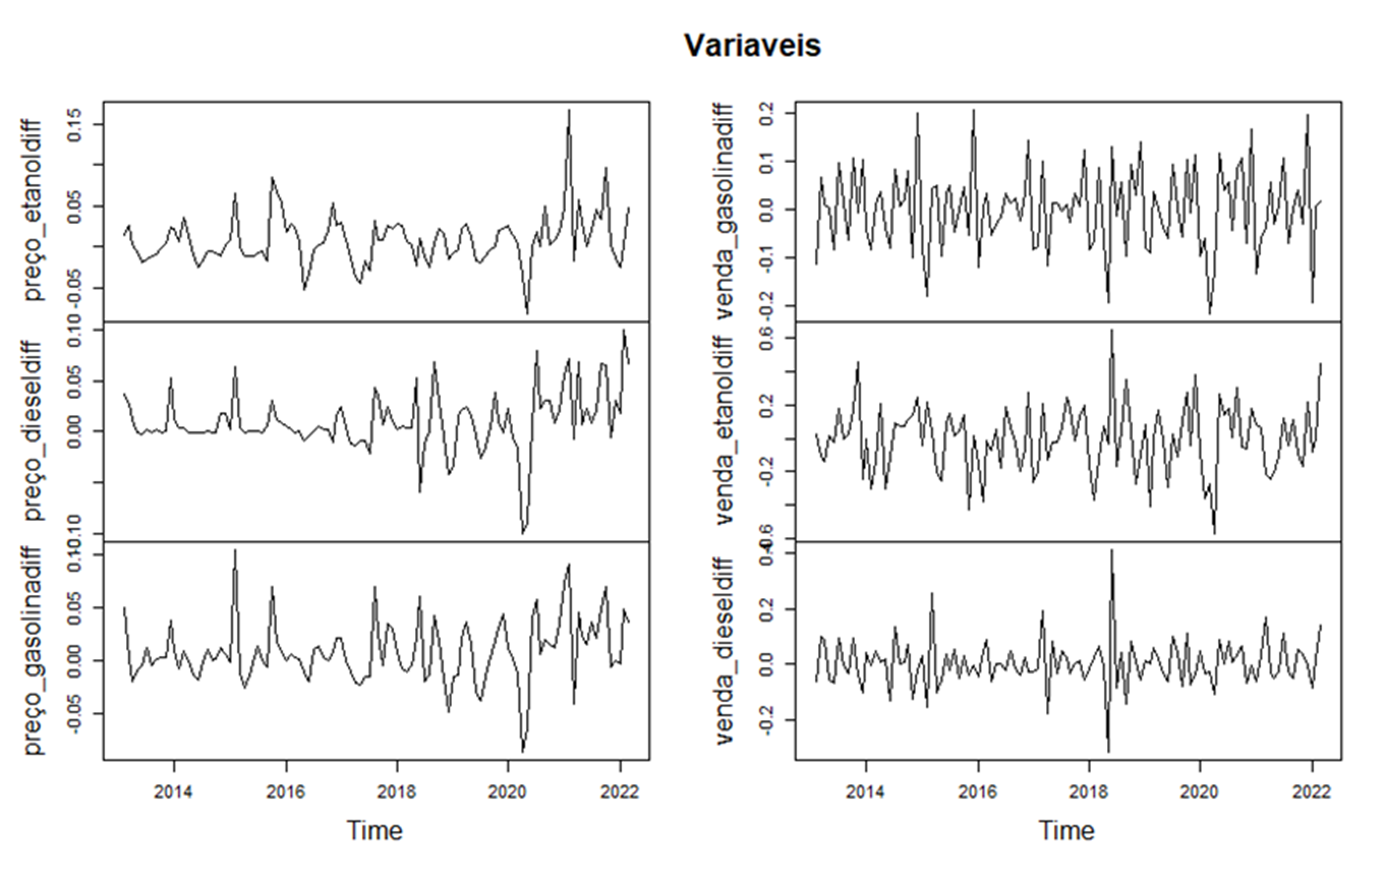
Analyses by Selfregressive Vectors (VAR) were adopted because they are time series, as well as the interrelationship between the variables. The samples were collected in monthly data for the State of Santa Catarina for the following time series:
- Gasoline sales to Dealer Stations (m3)
- Ethanol Sales to Retail Stations (m3)
- Sales of diesel oil to Dealer Stations (m3)
- Average resale price of gasoline to dealer stations (R$/L)
- Average ethanol resale price at retail stations (R$/L)
- Average resale price of diesel to dealer stations (R$/L)
All series were collected and organized for the period between January 2013 and April 2022, transformed into Natural Logarithmic. We analyzed the stationary of the variables, procedures of necessary differentiations, lags, p-values of approval in the equations developed in the autoregressive vectors, granger causality tests and impulse-response function. Data were collected exclusively at the Brazilian Open Data Portal, organized by the National Agency for Petroleum, Natural Gas and Biofuels (ANP, 2022). The series were smoothed by Natural Logarithmic procedures and then passed to the first difference in order to obtain approvals in the parking tests, according to the table of results of the p-values of the ADF test below:
| Parking ADF Test | |
| Time Series | P-value |
| VENDA_GASOLINA | 0.01 |
| VENDA_ETANOL | 0.01 |
| VENDA_DIESEL | 0.01 |
| PREÇO_GASOLINA | 0.01 |
| PREÇO_ETANOL | 0.01 |
| PREÇO_DIESEL | 0.02 |
The results will be exposed in table format to facilitate observations, highlighting only the main impulse-response graphs in sequence of the results of predictive equations and granger causality tests. The autorregressive vectors expressed 1 lag of delay in the monthly analyses.
Two caveats deserve attention:
(1) when a variable obtained an approximation to the approval in its p-value of the matrix of the autorregressive vectors (close to 10%), the p-values of granger causality were also approached to confirm its adhering to the analyses or not. Confirming the adherence of the variable, its Impulse-Response Function graph was rotated.
(2) the analysis of granger causality does not run for self-impacts (autoregressive) of Y. Thus, only the p-values of the vector matrix and the FIR were approached for analysis of its relevance in the predictive equation.
Equation 1: Diesel Price - State of Santa Catarina
| preço_dieseldiff = preço_etanoldiff.l1 + preço_dieseldiff.l1 + preço_gasolinadiff.l1 + venda_gasolinadiff.l1 + venda_etanoldiff.l1 + venda_dieseldiff.l1 + const |
| Estimate Std. Error t value Pr(>|t|) |
| preço_etanoldiff.l1 -0.124750 0.141679 -0.881 0.38065 |
| preço_dieseldiff.l1 0.457728 0.148737 3.077 0.00268 ** |
| preço_gasolinadiff.l1 -0.042900 0.216251 -0.198 0.84314 |
| venda_gasolinadiff.l1 -0.030867 0.038025 -0.812 0.41883 |
| venda_etanoldiff.l1 0.040005 0.019790 2.022 0.04585 * |
| venda_dieseldiff.l1 0.046234 0.034931 1.324 0.18860 |
| const 0.007075 0.002702 2.618 0.01019 * |
| --- |
| Signif. codes: 0 '***' 0.001 '**' 0.01 '*' 0.05'.' 0.1 ' ' 1 |
| F-statistic: 4,906 on 6 and 102 DF, p-value: 0.0001912 |
| Granger Causality | FIR – Impulse ↑ in X | ||||
| Y | X | Resultado | P-value | Lag | Y Result |
| Preço_diesel | Venda_etanol | Aprovado | 0.002933 | 1 | ↑ |
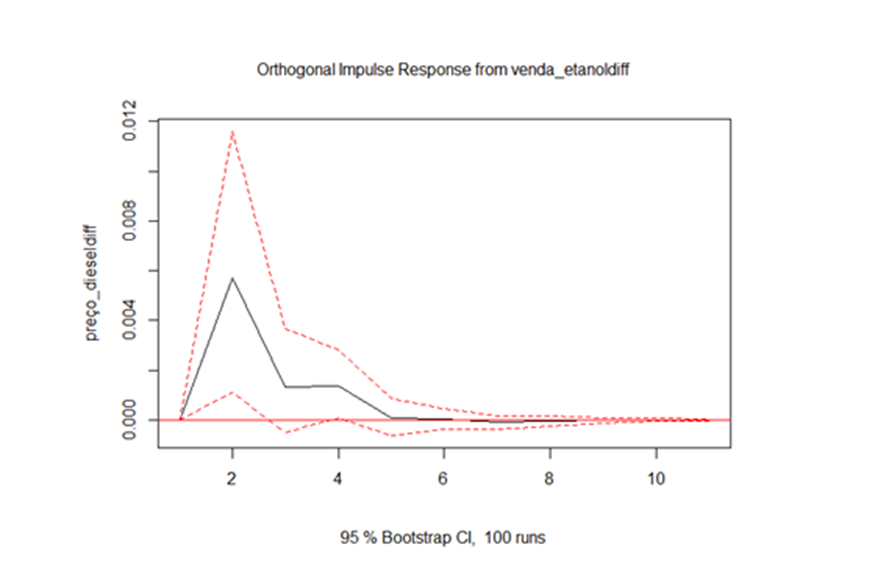
Conclusions:
1. An increase in the sale of ethanol increases the price of diesel for up to five months
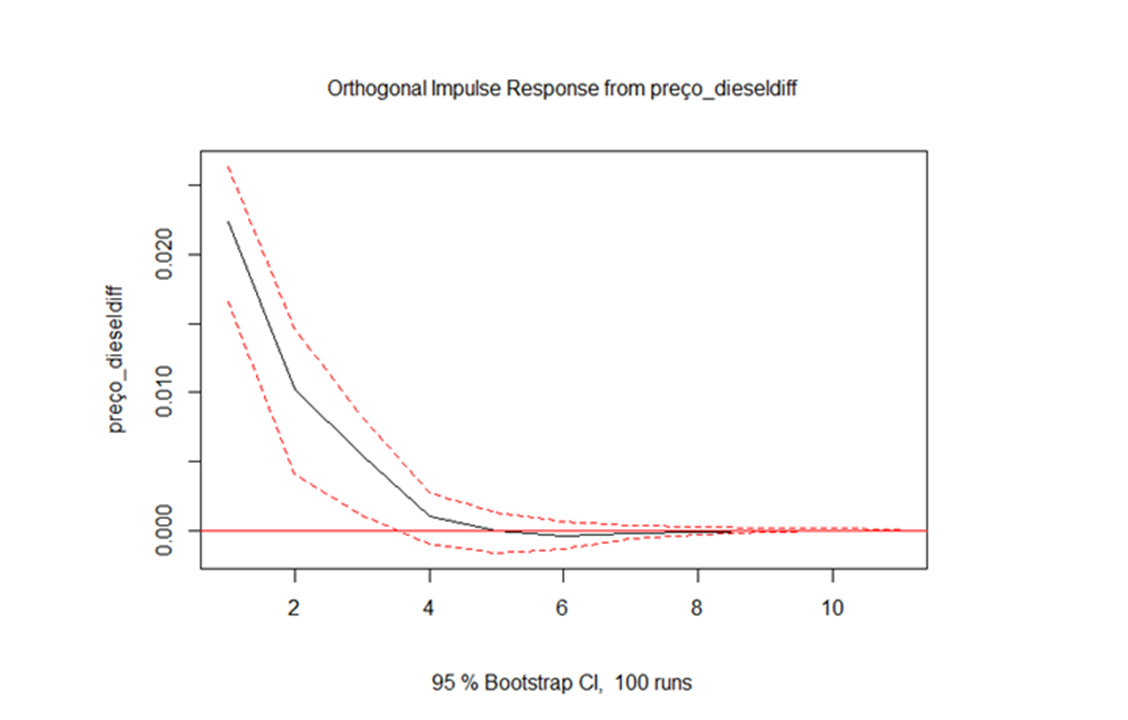
2. A boost in the price of diesel, increase your own price in up to five months
Equation 2: Gasoline Price - State of Santa Catarina
| preço_gasolinadiff = preço_etanoldiff.l1 + preço_dieseldiff.l1 + preço_gasolinadiff.l1 + venda_gasolinadiff.l1 + venda_etanoldiff.l1 + venda_dieseldiff.l1 + const |
| Estimate Std. Error t value Pr(>|t|) |
| preço_etanoldiff.l1 -0.288219 0.146140 -1.972 0.0513 . |
| preço_dieseldiff.l1 0.249168 0.153420 1.624 0.1074 |
| preço_gasolinadiff.l1 0.224879 0.223059 1,008 0.3158 |
| venda_gasolinadiff.l1 0.012678 0.039223 0.323 0.7472 |
| venda_etanoldiff.l1 0.020531 0.020413 1.006 0.3169 |
| venda_dieseldiff.l1 -0.031368 0.036031 -0.871 0.3860 |
| const 0.006582 0.002787 2.361 0.0201 * |
| --- |
| Signif. codes: 0 '***' 0.001 '**' 0.01 '*' 0.05'.' 0.1 ' ' 1 |
| F-statistic: 3,646 on 6 and 102 DF, p-value: 0.002549 |
| Causalidade de Granger | FIR – Impulso ↑ em X | ||||
| Y | X | Resultado | P-value | Lag | Resultado em Y |
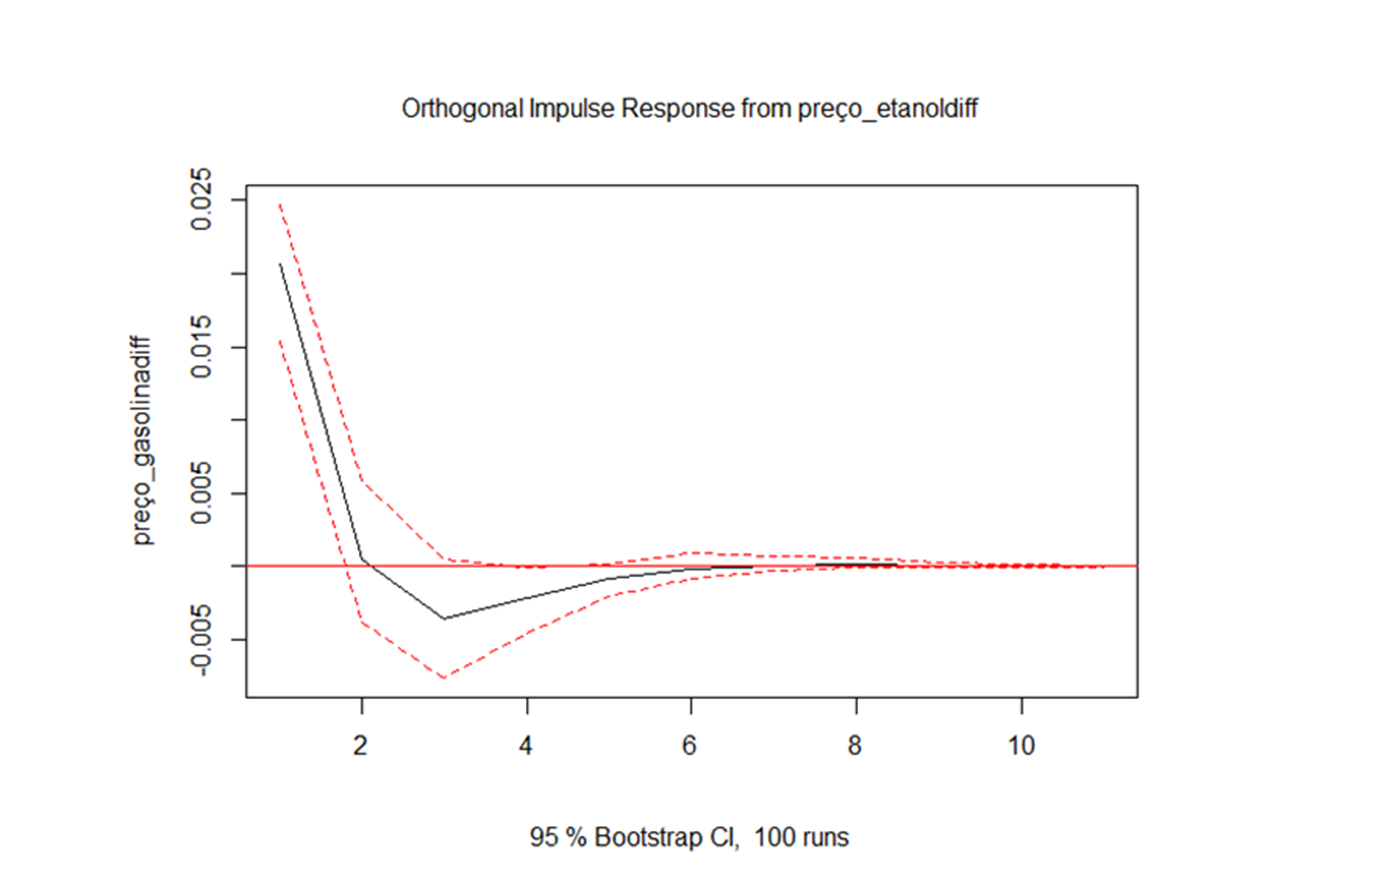
| Preço_gasolina | Preço_etanol | Aprovado | 0.003016 | 1 | ↑ |
| Causality of Granger | ||||
| Y | X | Result | P-value | Lag |
| Preço_gasolina | Preço_diesel | Failed | 0.1413 | 1 |
Conclusions:
1. An increase in the price of ethanol, increases the price of gasoline for up to two months
Equation 3: Ethanol Price - State of Santa Catarina
| preço_etanoldiff = preço_etanoldiff.l1 + preço_dieseldiff.l1 + preço_gasolinadiff.l1 + venda_gasolinadiff.l1 + venda_etanoldiff.l1 + venda_dieseldiff.l1 + const |
| Estimate Std. Error t value Pr(>|t|) |
| preço_etanoldiff.l1 0.034789 0.151782 0.229 0.819 |
| preço_dieseldiff.l1 0.228756 0.159343 1,436 0.154 |
| preço_gasolinadiff.l1 0.288392 0.231671 1,245 0.216 |
| venda_gasolinadiff.l1 0.013101 0.040737 0.322 0.748 |
| venda_etanoldiff.l1 -0.008122 0.021201 -0.383 0.702 |
| venda_dieseldiff.l1 0.008521 0.037422 0.228 0.820 |
| const 0.003719 0.002895 1,285 0.202 |
| --- |
| Signif. codes: 0 '***' 0.001 '**' 0.01 '*' 0.05'.' 0.1 ' ' 1 |
| F-statistic: 4,657 on 6 and 102 DF, p-value: 0.0003181 |
| Causality of Granger | FIR - Impulse ↑ in X | ||||
| Y | X | Result | P-value | Lag | Y-bottom result |
| Preço_etanol | Preço_diesel | Approved | 0.001989 | 1 | ↑ |
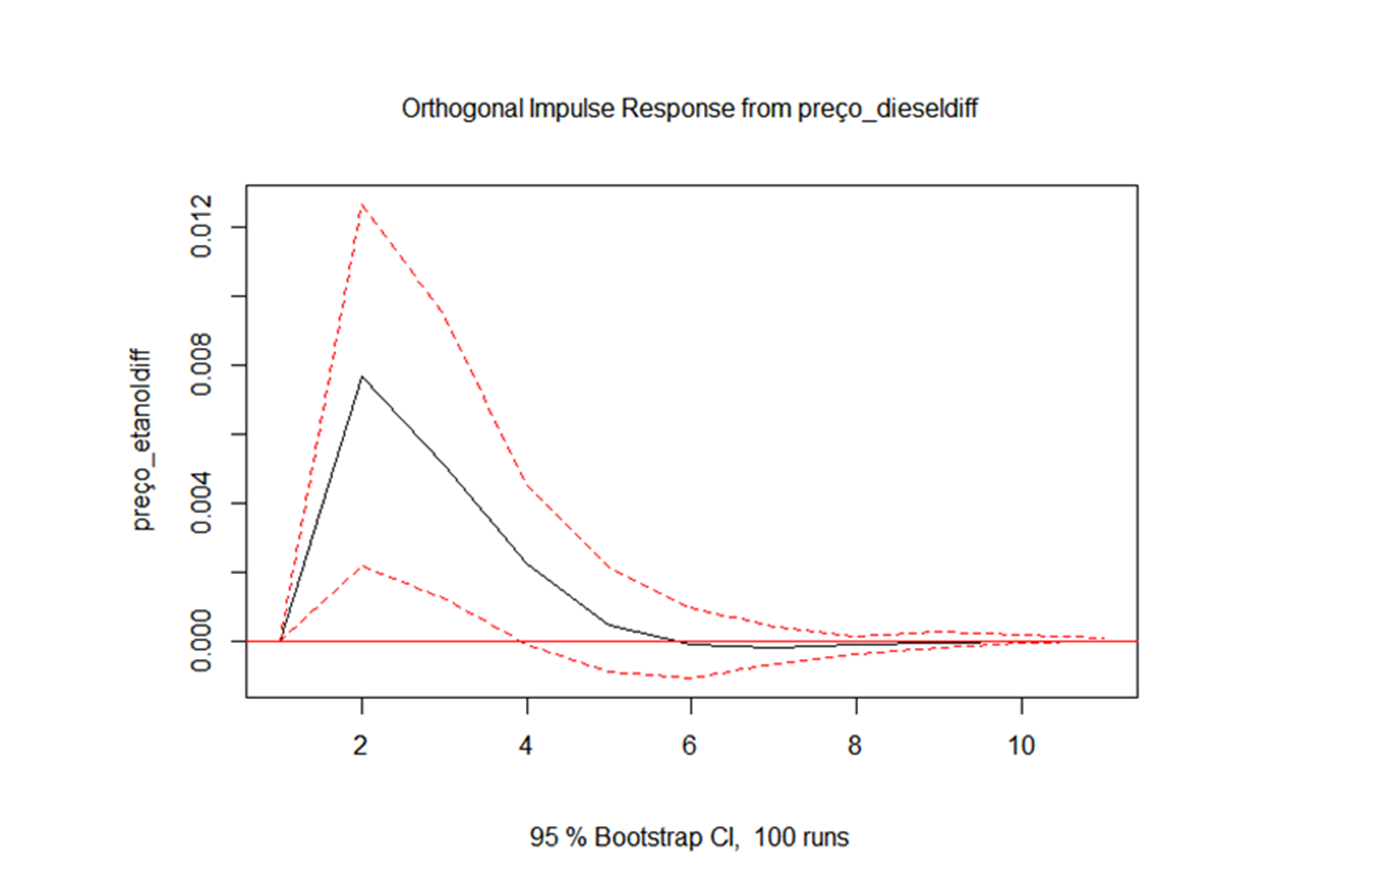
Conclusion:
1. An increase in the price of diesel, increases the price of ethanol for up to six months
Equation 4: Diesel Sale - State of Santa Catarina
| venda_dieseldiff = preço_etanoldiff.l1 + preço_dieseldiff.l1 + preço_gasolinadiff.l1 + venda_gasolinadiff.l1 + venda_etanoldiff.l1 + venda_dieseldiff.l1 + const |
| Estimate Std. Error t value Pr(>|t|) |
| preço_etanoldiff.l1 -0.4151218 0.4123432 -1,007 0.316443 |
| preço_dieseldiff.l1 -0.0029791 0.4328838 -0.007 0.994522 |
| preço_gasolinadiff.l1 0.9957006 0.6293754 1,582 0.116735 |
| venda_gasolinadiff.l1 -0.1040774 0.1106691 -0.940 0.349215 |
| venda_etanoldiff.l1 -0.0535512 0.0575961 -0.930 0.354684 |
| venda_dieseldiff.l1 -0.3880267 0.1016643 -3.817 0.000232 *** |
| const -0.0001491 0.0078640 -0.019 0.984915 |
| --- |
| Signif. codes: 0 '***' 0.001 '**' 0.01 '*' 0.05'.' 0.1 ' ' 1 |
| F-statistic: 6,656 on 6 and 102 DF, p-value: 5.787e-06 |
| Causality of Granger | FIR - Impulse ↑ in X | ||||
| Y | X | Result | P-value | Lag | Y-bottom result |
| Venda_diesel | Preço_gasolina | Approved | 0.04385 | 1 | ↑ |
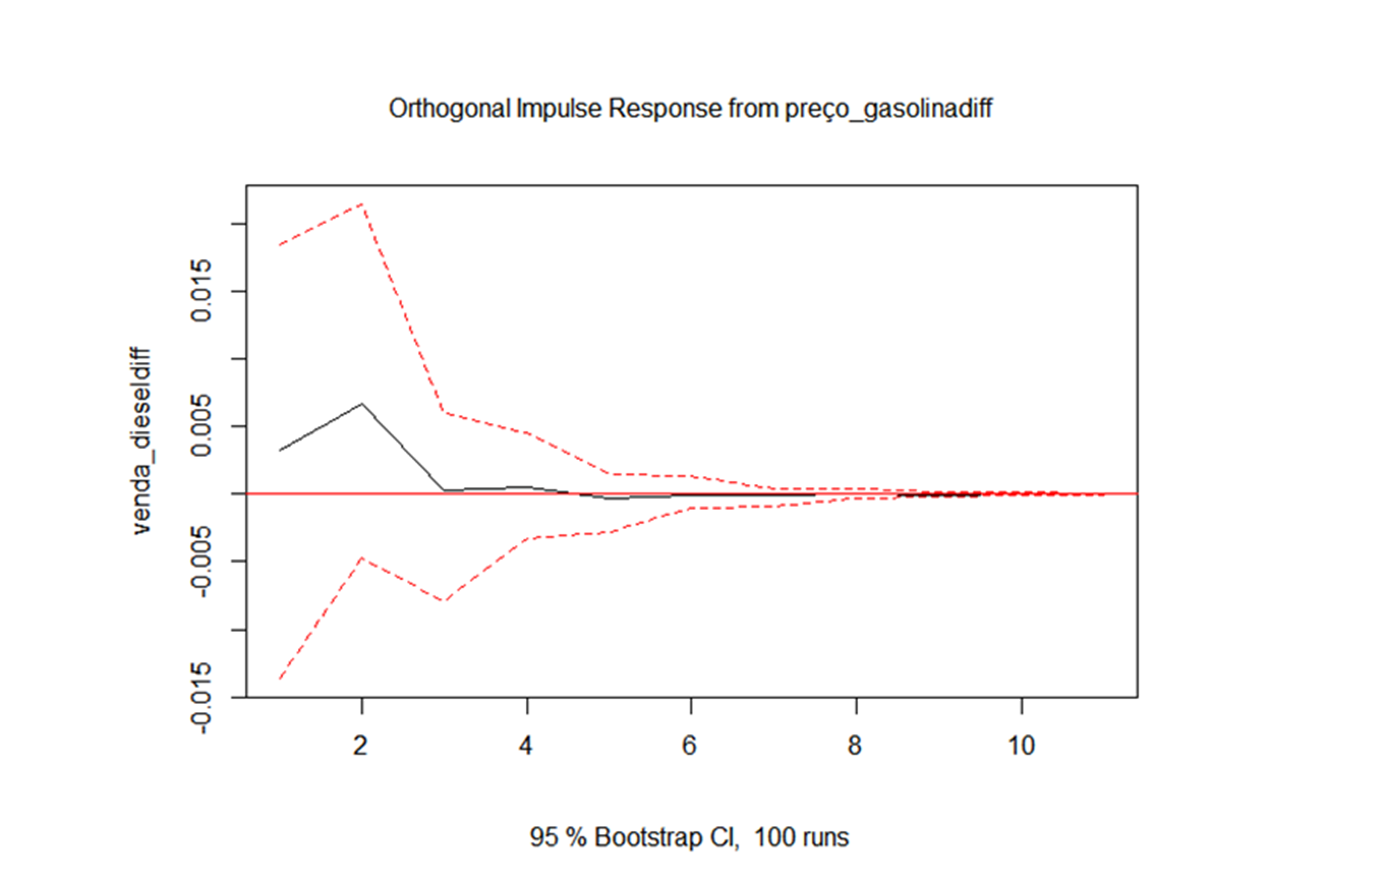
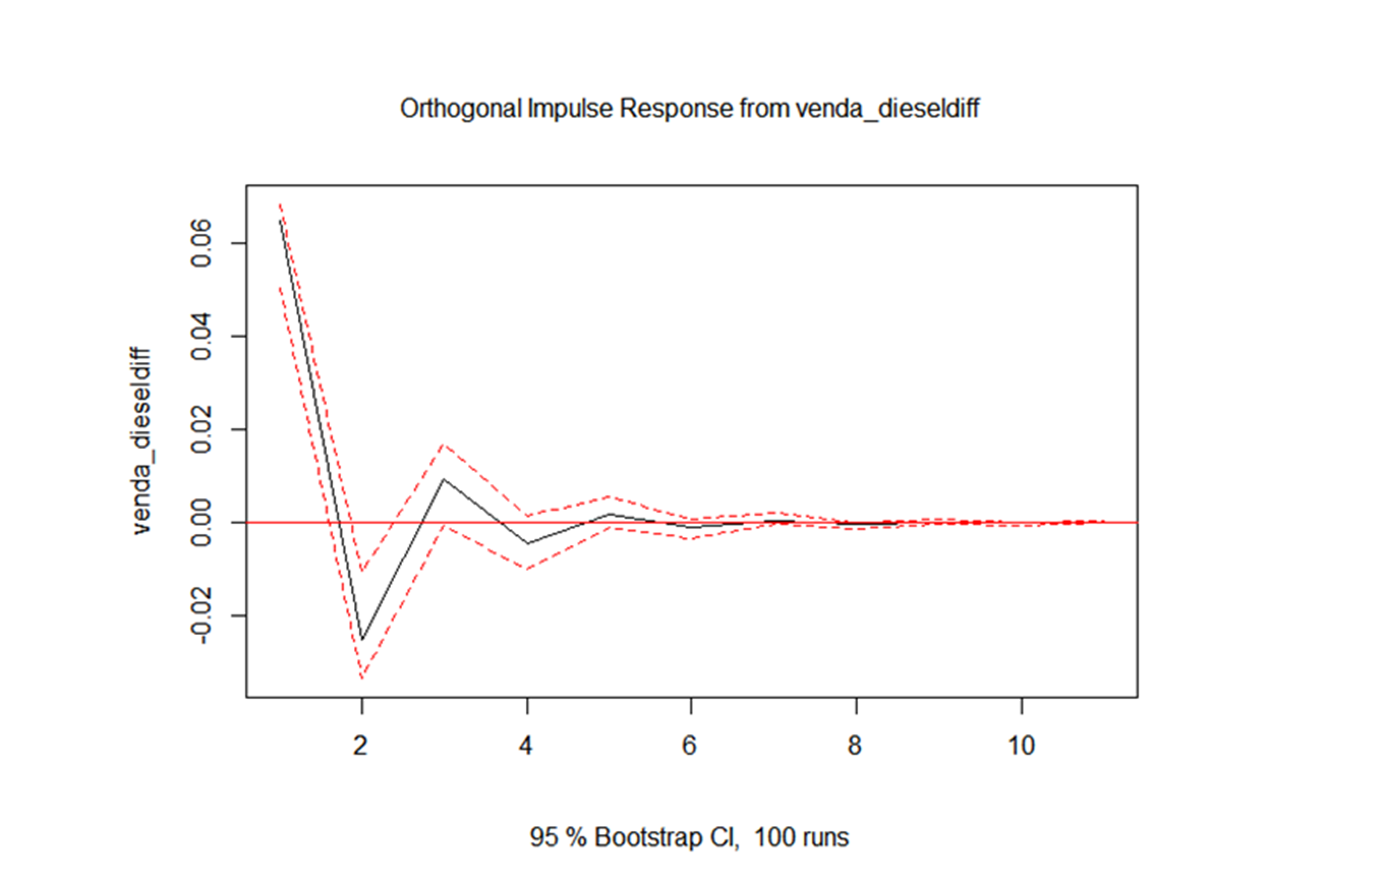
Conclusions:
1. An increase in the price of gasoline, slightly increases the sale of diesel for up to three months
2. A boost in diesel sales, strongly increases your own sale for up to a month
Equation 5: Sale of Gasoline - State of Santa Catarina
| venda_gasolinadiff = preço_etanoldiff.l1 + preço_dieseldiff.l1 + preço_gasolinadiff.l1 + venda_gasolinadiff.l1 + venda_etanoldiff.l1 + venda_dieseldiff.l1 + const |
| Estimate Std. Error t value Pr(>|t|) |
| preço_etanoldiff.l1 -0.105382 0.442312 -0.238 0.8122 |
| preço_dieseldiff.l1 -0.007173 0.464346 -0.015 0.9877 |
| preço_gasolinadiff.l1 -0.087595 0.675118 -0.130 0.8970 |
| venda_gasolinadiff.l1 -0.292986 0.118713 -2.468 0.0152 * |
| venda_etanoldiff.l1 0.005935 0.061782 0.096 0.9237 |
| venda_dieseldiff.l1 -0.051120 0.109053 -0.469 0.6402 |
| const 0.005182 0.008436 0.614 0.5404 |
| --- |
| Signif. codes: 0 '***' 0.001 '**' 0.01 '*' 0.05'.' 0.1 ' ' 1 |
| F-statistic: 2,024 on 6 and 102 DF, p-value: 0.06918 |
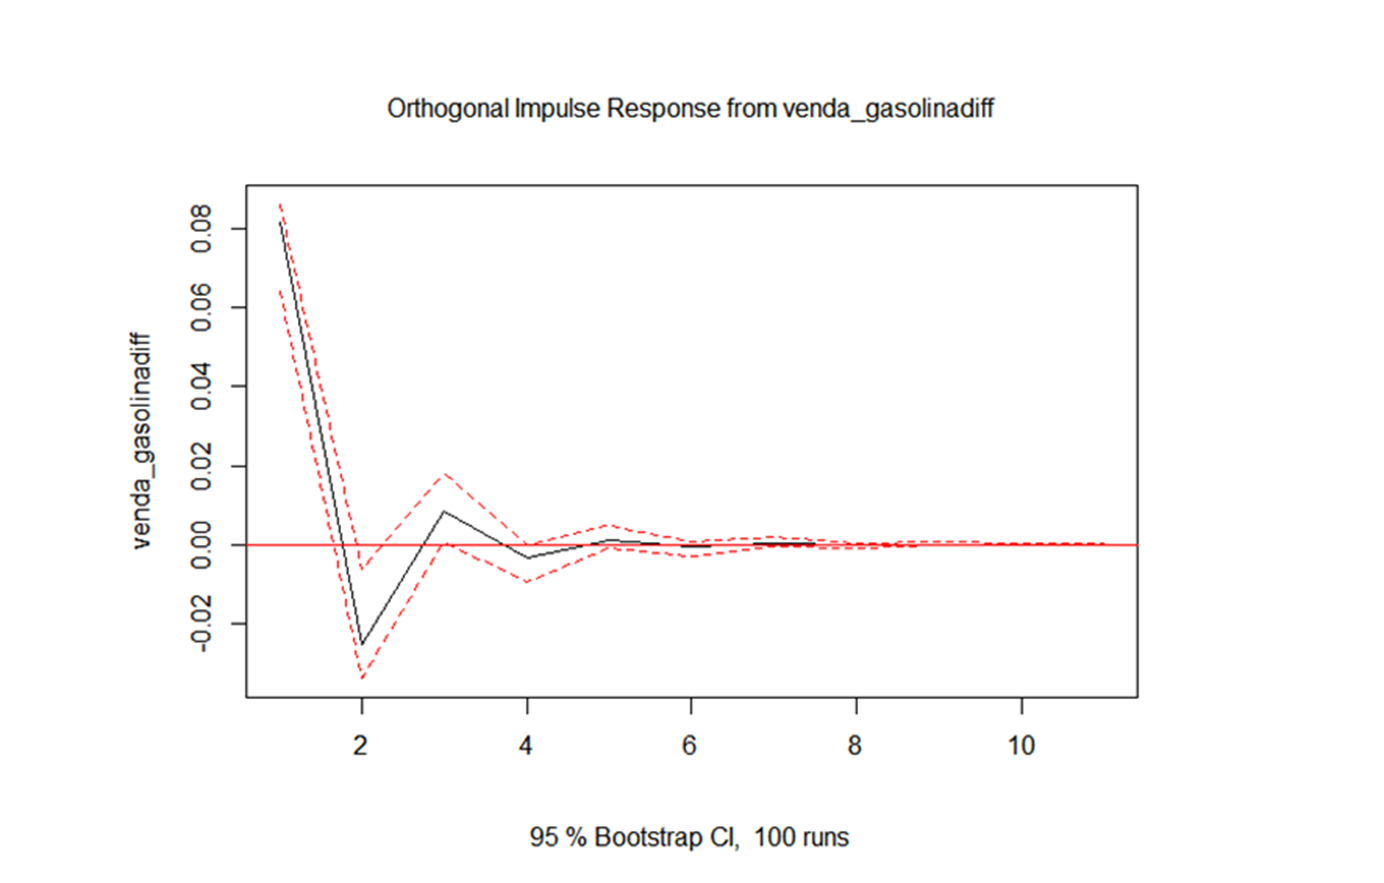
Conclusion:
1. An increase in gasoline sales, strongly increases its own sales for up to a month
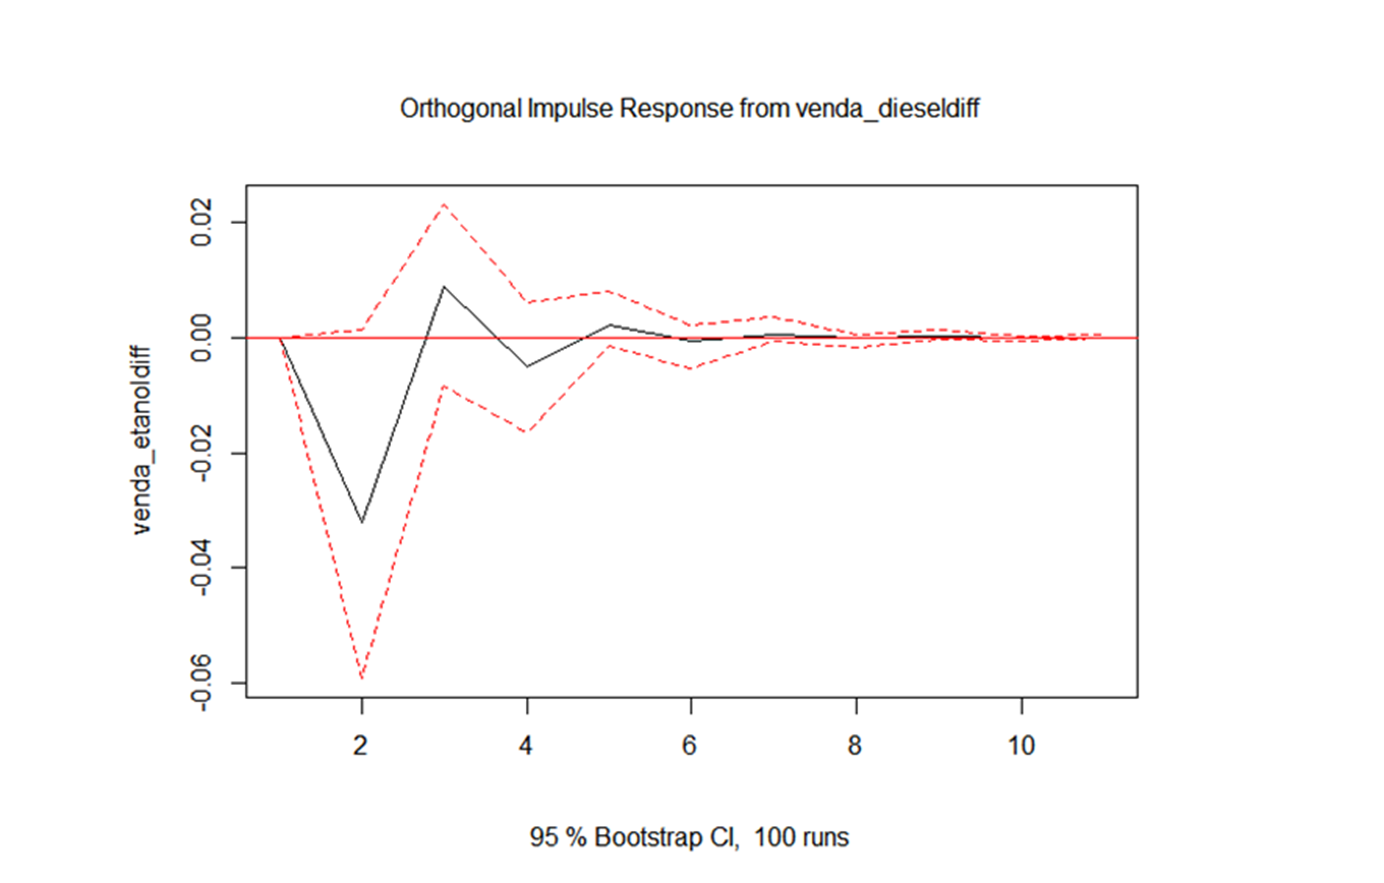
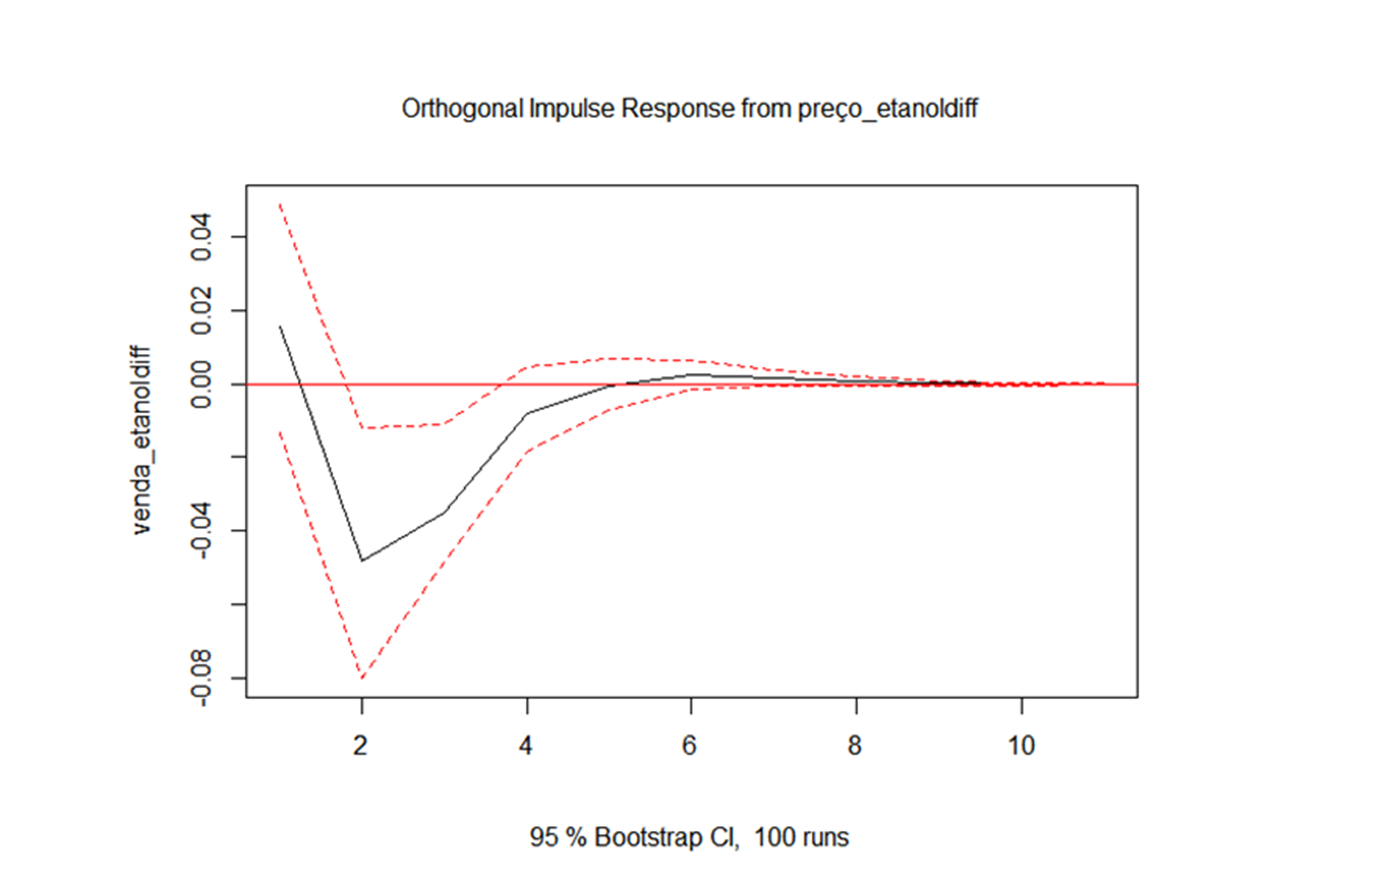
Equation 6: Ethanol Sales - State of Santa Catarina
| venda_etanoldiff = preço_etanoldiff.l1 + preço_dieseldiff.l1 + preço_gasolinadiff.l1 + venda_gasolinadiff.l1 + venda_etanoldiff.l1 + venda_dieseldiff.l1 + const |
| Estimate Std. Error t value Pr(>|t|) |
| preço_etanoldiff.l1 -3.643958 1.016909 -3,583 0.000522 *** |
| preço_dieseldiff.l1 0.147747 1.067566 0.138 0.890200 |
| preço_gasolinadiff.l1 2.489217 1.552148 1,604 0.111867 |
| venda_gasolinadiff.l1 0.284777 0.272929 1,043 0.299225 |
| venda_etanoldiff.l1 -0.125733 0.142042 -0.885 0.378139 |
| venda_dieseldiff.l1 -0.493544 0.250722 -1.968 0.051725 . |
| const 0.004581 0.019394 0.236 0.813728 |
| --- |
| Signif. codes: 0 '***' 0.001 '**' 0.01 '*' 0.05'.' 0.1 ' ' 1 |
| F-statistic: 3,615 on 6 and 102 DF, p-value: 0.002722 |
| Causality of Granger | FIR - Impulse ↑ in X | ||||
| Y | X | Result | P-value | Lag | Y-bottom result |
| Venda_etanol | Venda_diesel | Approved | 0.01639 | 1 | ↓ |
| Causality of Granger | FIR - Impulse ↑ in X | ||||
| Y | X | Result | P-value | Lag | Y-bottom result |
| Venda_etanol | Preço_etanol | Approved | 0.002376 | 1 | ↓ |
| Causality of Granger | ||||
| Y | X | Result | P-value | Lag |
| Venda_etanol | Preço_gasolina | Failed | 0.3958 | 1 |
Conclusions:
1. An increase in diesel sales decreases ethanol sales for up to three months
2. A decrease in the price of ethanol decreases the sale of ethanol for up to five months
References:
ANP. Preços de Revenda e de Distribuição de Combustíveis. Disponível em: https://www.gov.br/anp/pt-br/assuntos/precos-e-defesa-da-concorrencia/precos/precos-revenda-e-de-distribuicao-combustiveis/. Acesso em 02 maio 2022
ANP. Vendas de derivados de petróleo e biocombustíveis em: https://dados.gov.br/dataset/vendas-de-derivados-de-petroleo-e-biocombustiveis acessado 10 maio 2022