The interrelationship between fuel sales (cubic meter), oil barrel price, IPCA and exchange rate in the states of Santa Catarina, São Paulo and Bahia
By Daniel Christian Henrique and Gabriel Dudena de Faria (Probolsas Scholar)
Fuel consumption in Brazil has a significant impact in several areas, either because it is part of the transportation logistics of the products of its companies, as well as the daily life of its population. Additionally, the fact that transport segments are routinely impacting the IPCA index in their monthly measurements of 2022, this variable is essential in these analyses, highlighting the fact that this index has reached its record value in the last 26 years (IBGE, 2022). Therefore, fuels are extremely important insums within our economy, especially diesel oil, considering that 60% of our national supply system is mainly based on transportation by highways, according to the Brazilian Infrastructure Center (CBIE, 2022).
Additionally, according to the Brazilian Petroleum and Gas Institute (IBP), since 2000 there has been a drastic increase in fuel consumption in Brazil, being: 266% for Hydrated Ethanol, 74% for gasoline and 77% for diesel oil: the main fuel used by cargo trucks.
Considering the notes of the plan presented by the EPE that diesel consumption will continue to increase and the country will not be able to be independent of the foreign market for at least another 1 decade, it is extremely important to know how the consumption of these fuels will impact the daily life of its population. Additionally, the fact that transport segments are routinely impacting the IPCA index in their monthly measurements, this variable is indispensable in these analyses.
This research will follow the script of analysis of time series by the methodology of the Autorregressive Vectors, since there is an interrelationship between the variables in analyses, collected in monthly units for the states of Santa Catarina, Bahia and São Paulo, which are:
- Gasoline sales to Dealer Stations (m3)
- Ethanol Sales to Retail Stations (m3)
- Sales of diesel oil to Dealer Stations (m3)
- IPCA
- WTI oil barrel quote
- Real exchange rate/dollar quote
All series were collected and organized for the period between January 2012 and March 2022. For each state, the stationary of the variables, procedures of necessary differentiations, lags, approval p-values in the equations developed in the autoregressive vectors, granger causality tests and impulse-response function were observed.
The sales variables of petroleum derivatives and biofuels (gasoline, ethanol and diesel oil) were collected in the Brazilian Open Data Portal, organized by the National Agency of Petroleum, Natural Gas and Biofuels (ANP, 2022). In the Economatica software, the variables IPCA, wti oil barrel and real exchange/dollar exchange rates were obtained. All series are in the first difference to obtain parking, according to the table of results of the p-values of the ADF test below:
| Parking ADF Test | |
| Time Series | P-value |
| GASOLINA_DIFF | 0.01 |
| ETANOL_DIFF | 0.01 |
| DIESEL_DIFF | 0.01 |
| WTI_DIFF | 0.01 |
| IPCA_DIFF | 0.01 |
| DOLAR_DIFF | 0.01 |
The comparative analyses between the three states will be exposed in table format to facilitate observations, highlighting only the main impulse-response graphs in sequence of the results of predictive equations and granger causality tests.
1 - STATE OF SANTA CATARINA
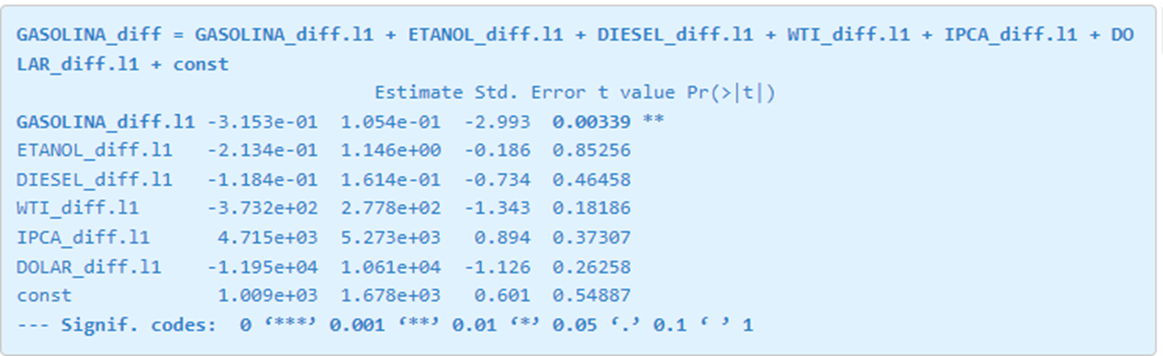
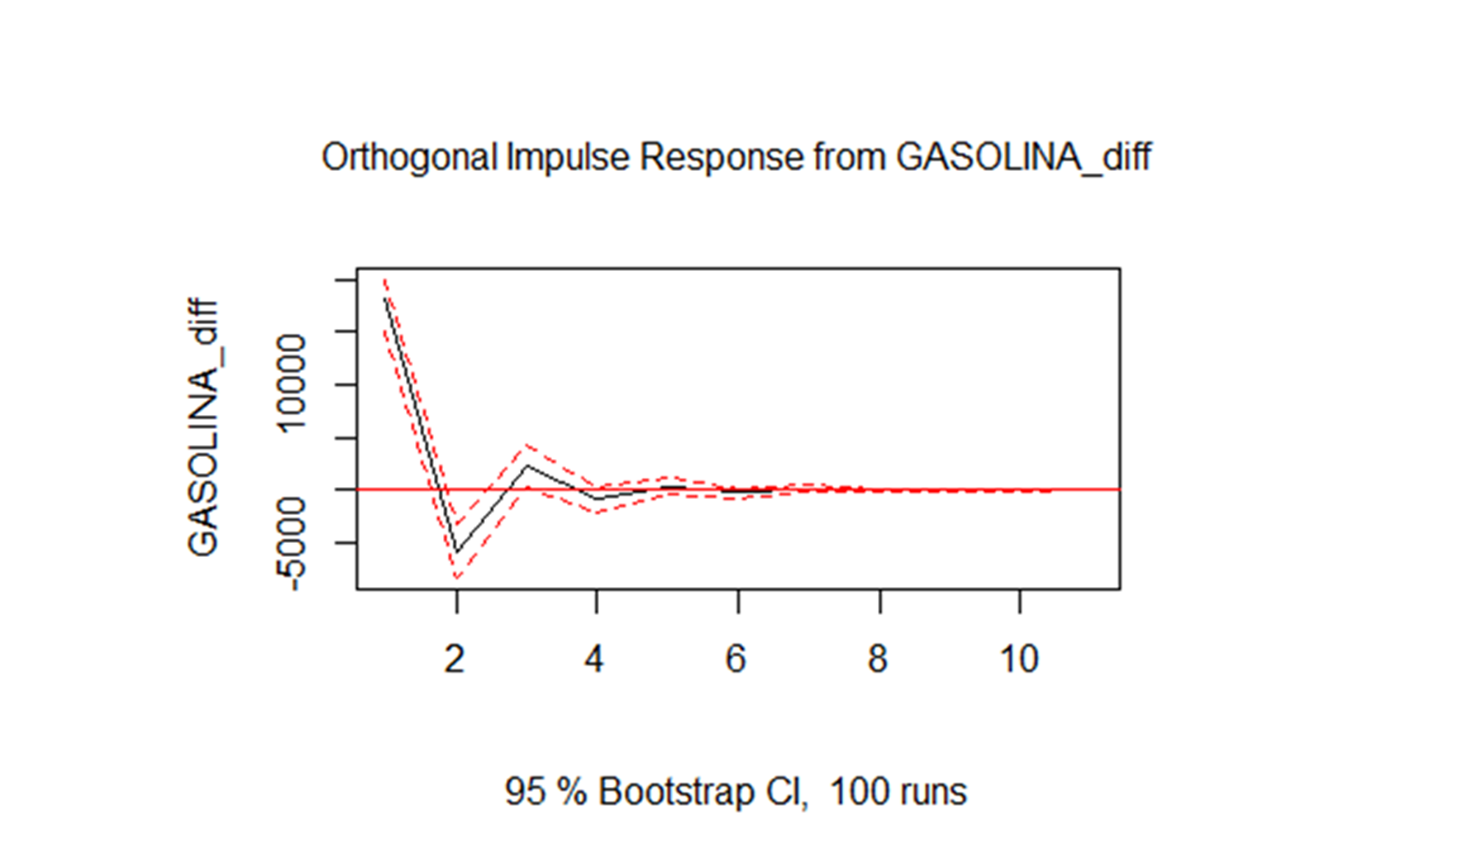
Equation 1: Gasoline - State of Santa Catarina
| Causality of Granger | FIR - Impulse ↑ in X | ||||
| Y | X | Result | P-value | Lag | Y-bottom result |
| Gasoline | Gasoline | Approved | 0.00339 | 1 | ↑ |
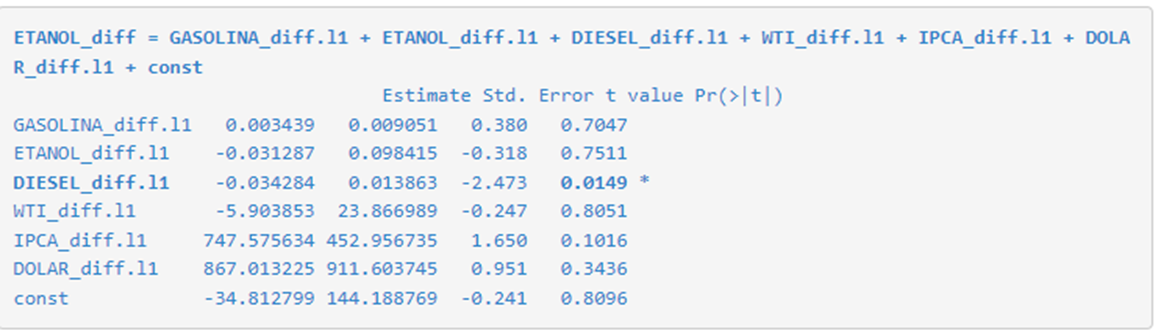
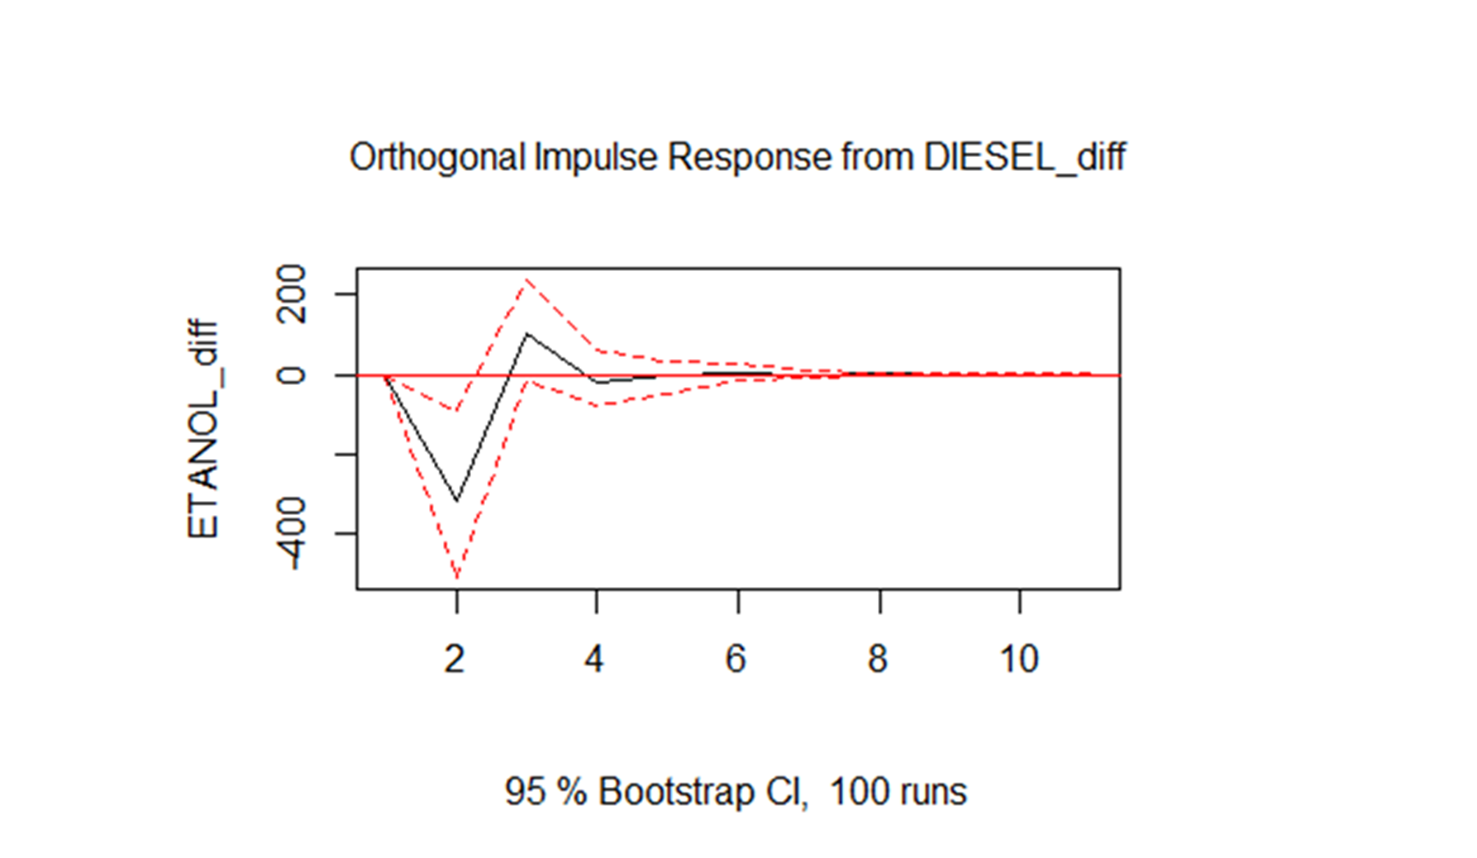
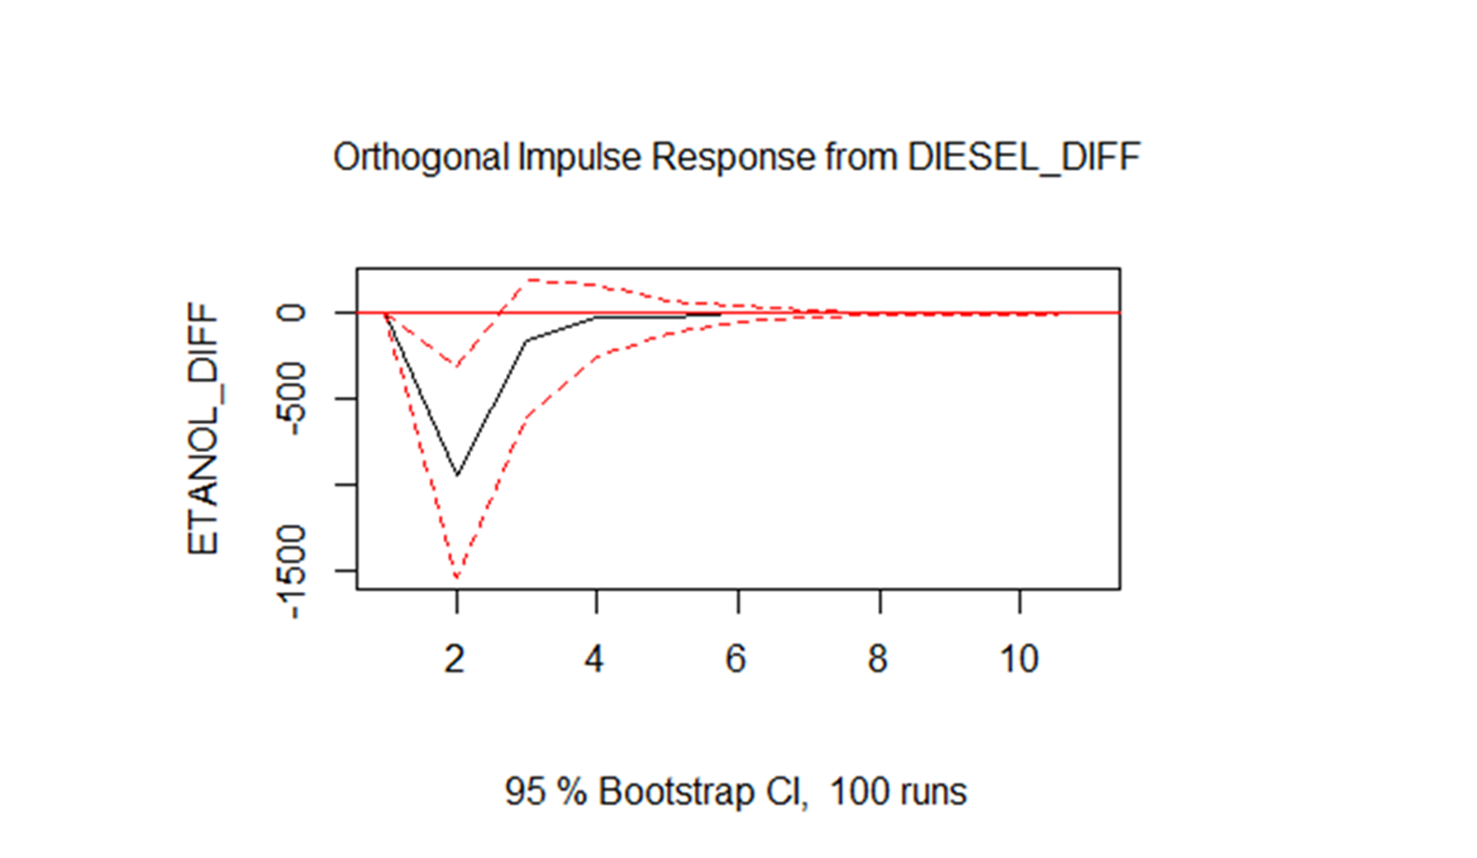
Equation 2: Ethanol - State of Santa Catarina
| Causality of Granger | FIR - Impulse ↑ in X | ||||
| Y | X | Result | P-value | Lag | Y-bottom result |
| Ethanol | Diesel | Approved | 0.0149 | 1 | ↓ |
Equation 3: Diesel - State of Santa Catarina
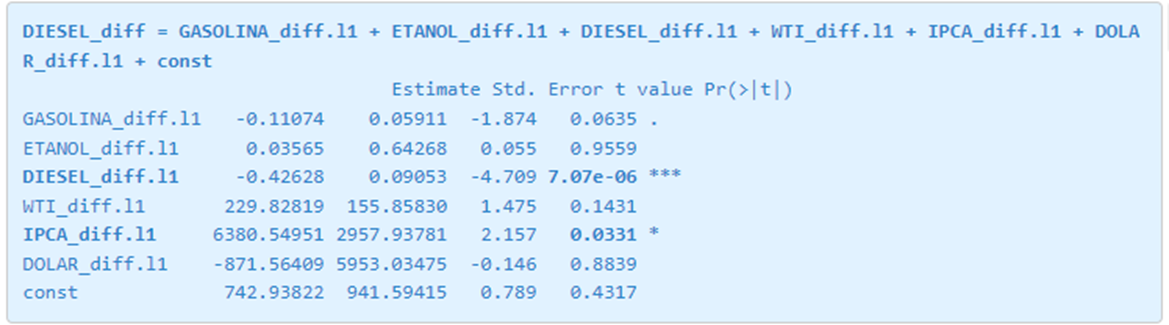
| Causality of Granger | FIR - Impulse ↑ in X | ||||
| Y | X | Result | P-value | Lag | Y-bottom result |
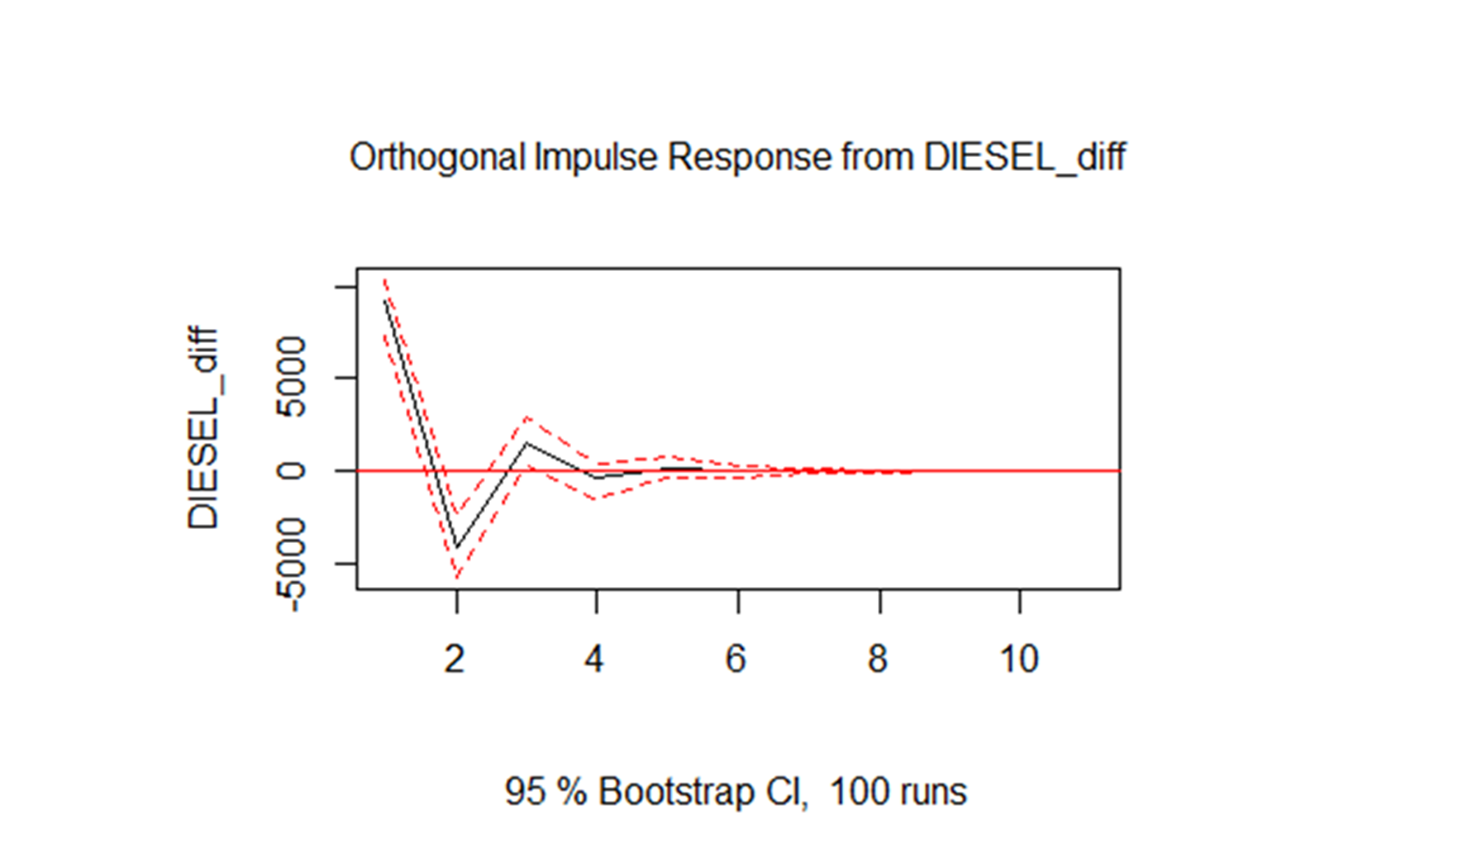
| Diesel | Diesel | Approved | 7.07e-06 | 1 | ↑ |
| Causality of Granger | FIR - Impulse ↑ in X | ||||
| Y | X | Result | P-value | Lag | Y-bottom result |
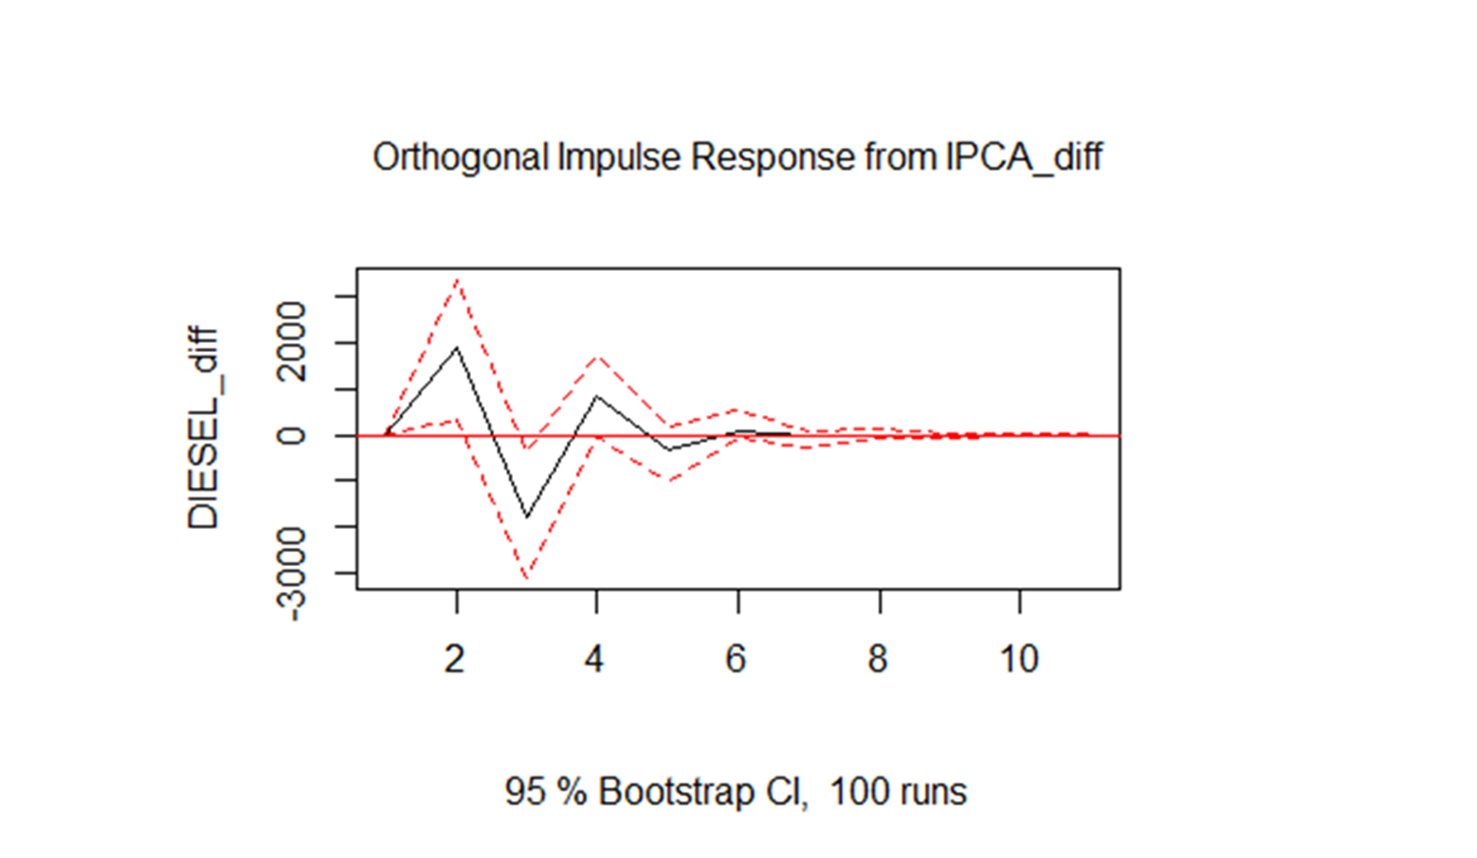
| Diesel | IPCA | Approved | 0.0331 | 1 | ↑↓ |
CONCLUSIONS FOR THE STATE OF SANTA CATARINA
1. Increased gasoline sales, increases gasoline sales by approximately one month
2. Increase in diesel sales, reduce ethanol sales by approximately three months
3. Increased diesel sales, increases diesel sales by approximately one month
4. Increase in diesel sales, increases the IPCA for approximately three months
2 - STATE OF SÃO PAULO
Equation 4: Diesel - State of São Paulo
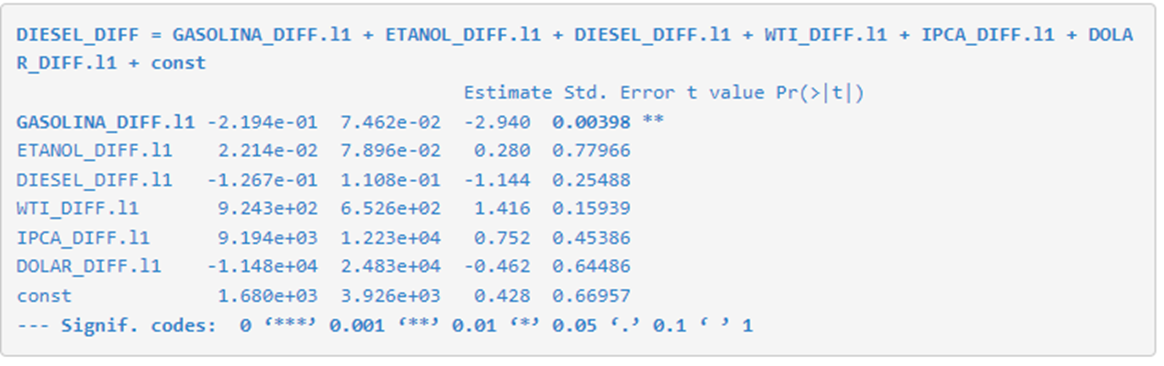
| Causality of Granger | FIR - Impulse ↑ in X | ||||
| Y | X | Result | P-value | Lag | Y-bottom result |
| Diesel | Gasoline | Approved | 0.00398 | 1 | ↑↓ |
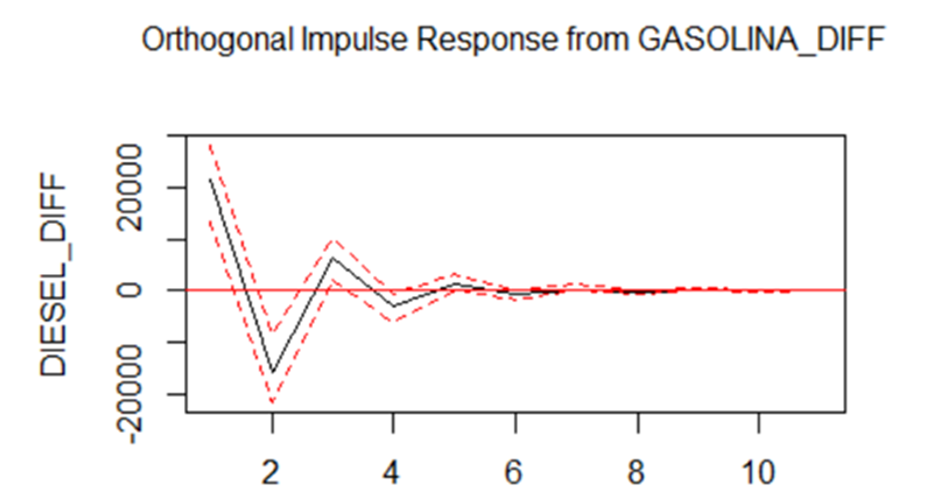
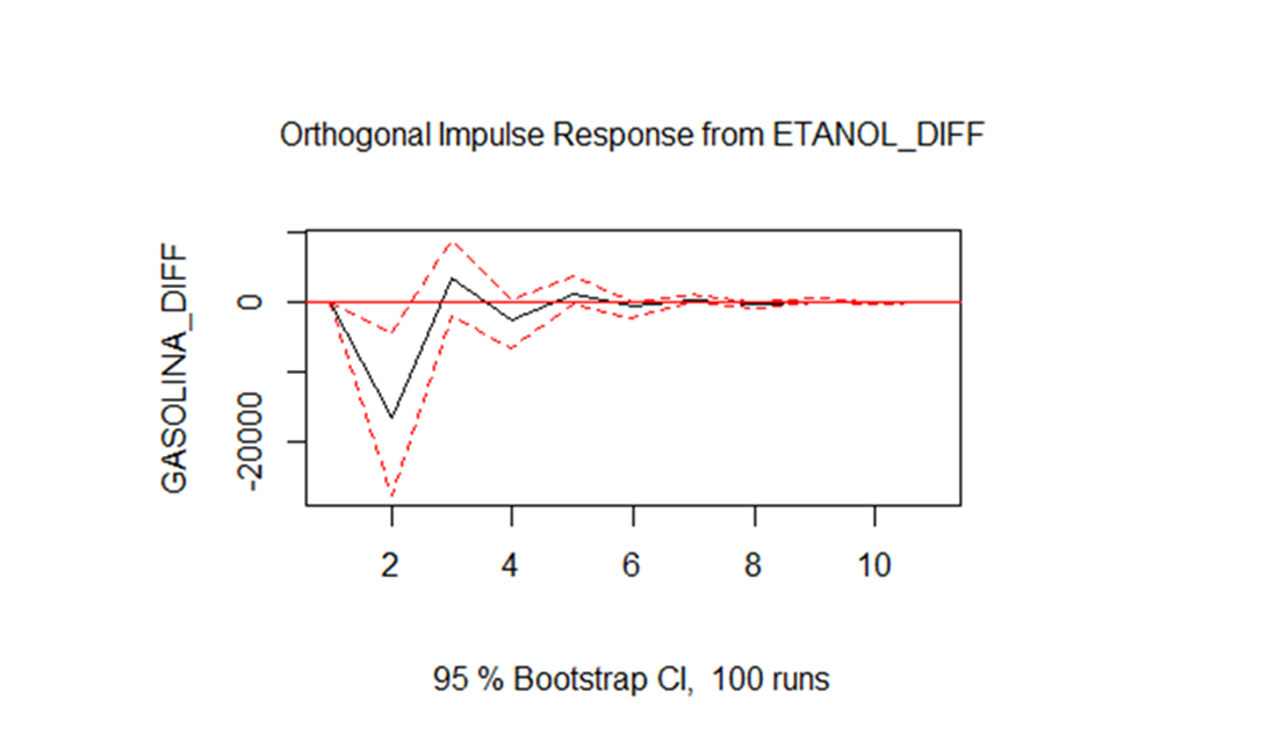
Equation 5: Gasoline - State of São Paulo
| Causality of Granger | FIR - Impulse ↑ in X | ||||
| Y | X | Result | P-value | Lag | Y-bottom result |
| Gasoline | Ethanol | Approved | 0.0143 | 1 | ↓ |
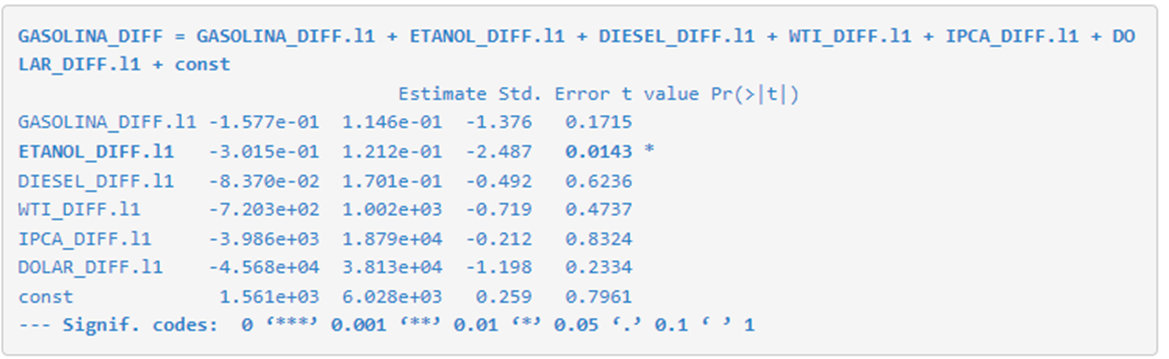
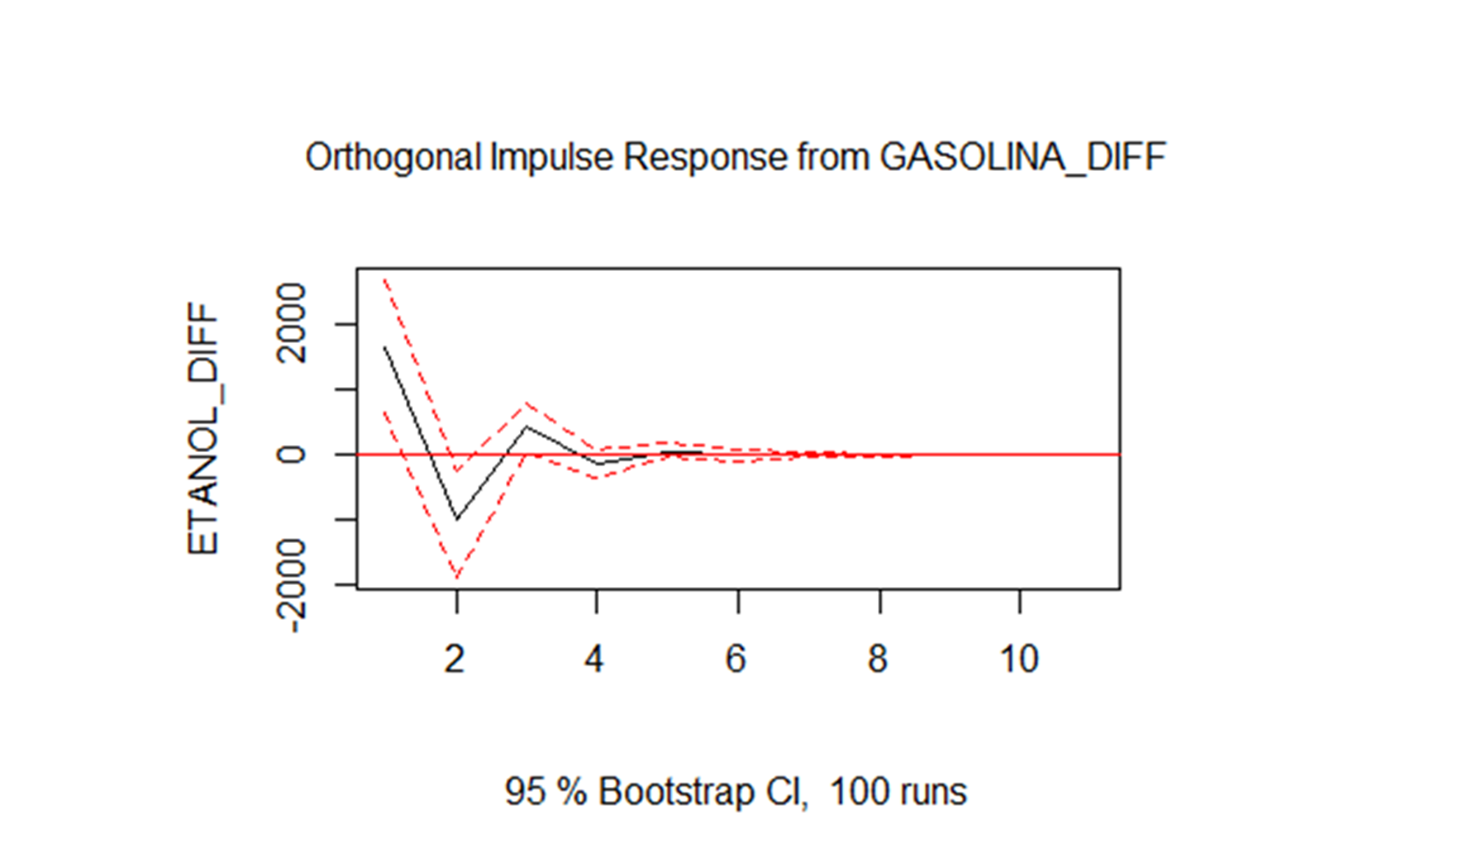
Equation 6: Ethanol - State of São Paulo
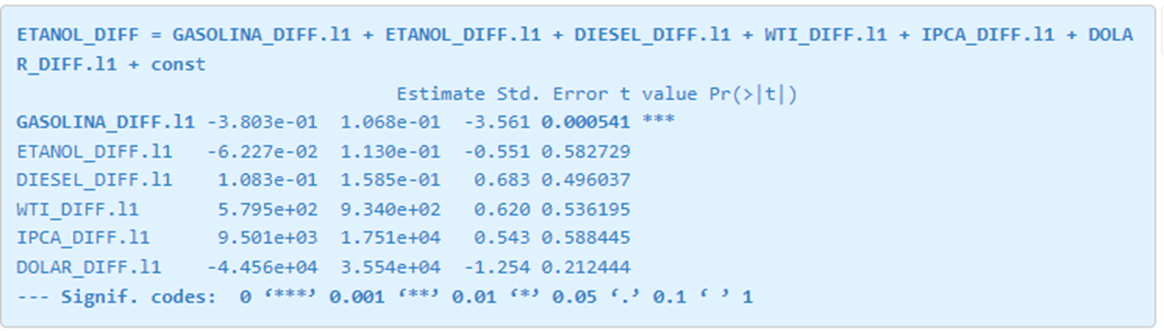
| Causality of Granger | FIR – Impulso ↑ em X | ||||
| Y | X | Resultado | P-value | Lag | Resultado em Y |
| Etanol | Gasoline | Approved | 0.000541 | 1 | ↑↓ |
CONCLUSIONS FOR THE STATE OF SÃO PAULO
1. Gasoline sales increase, diesel and ethanol sales increase for approximately one month
2. Increase in ethanol sales, reduces gasoline sales for approximately three months
3 - STATE OF BAHIA
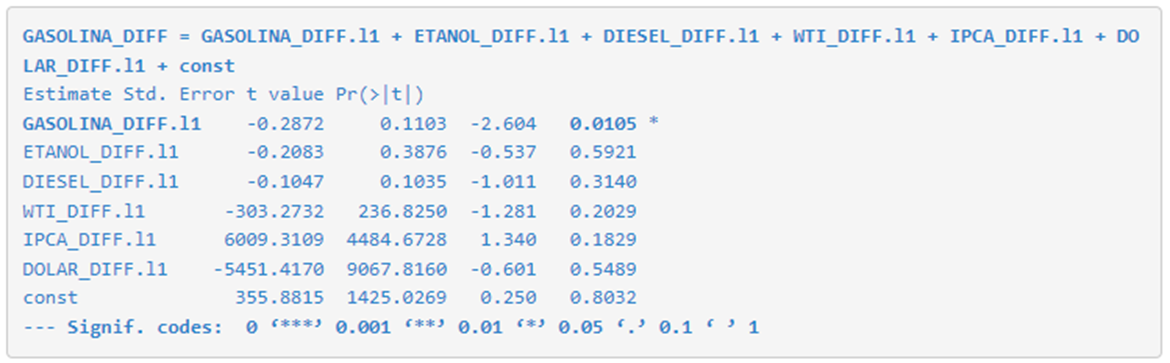
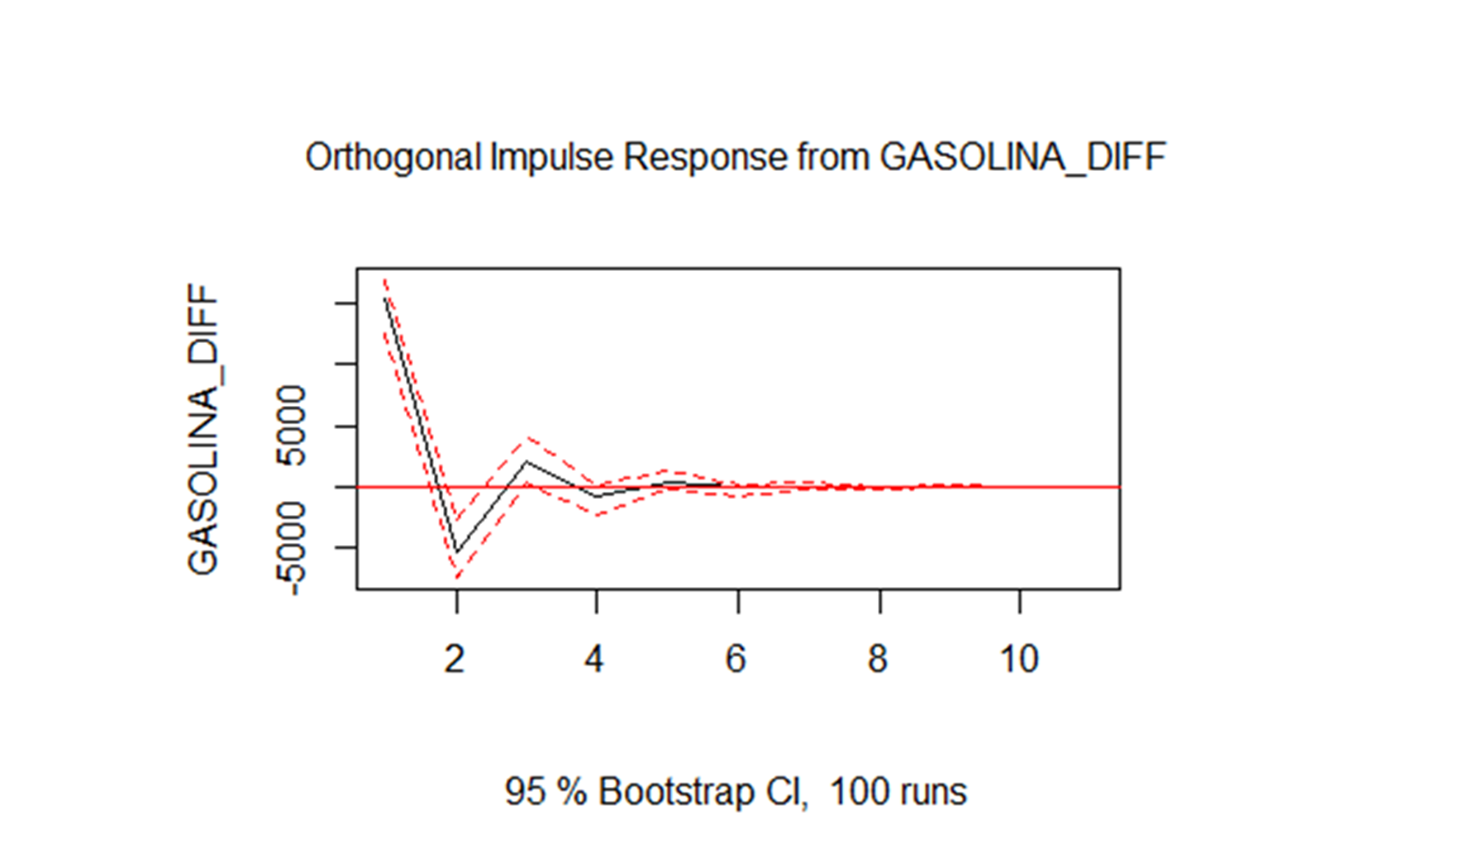
Equation 7: Gasoline - State of Bahia
| Causality of Granger | FIR – Impulse ↑ in X | ||||
| Y | X | Result | P-value | Lag | Result in Y |
| Gasoline | Gasoline | Approved | 0.0105 | 1 | ↑ |
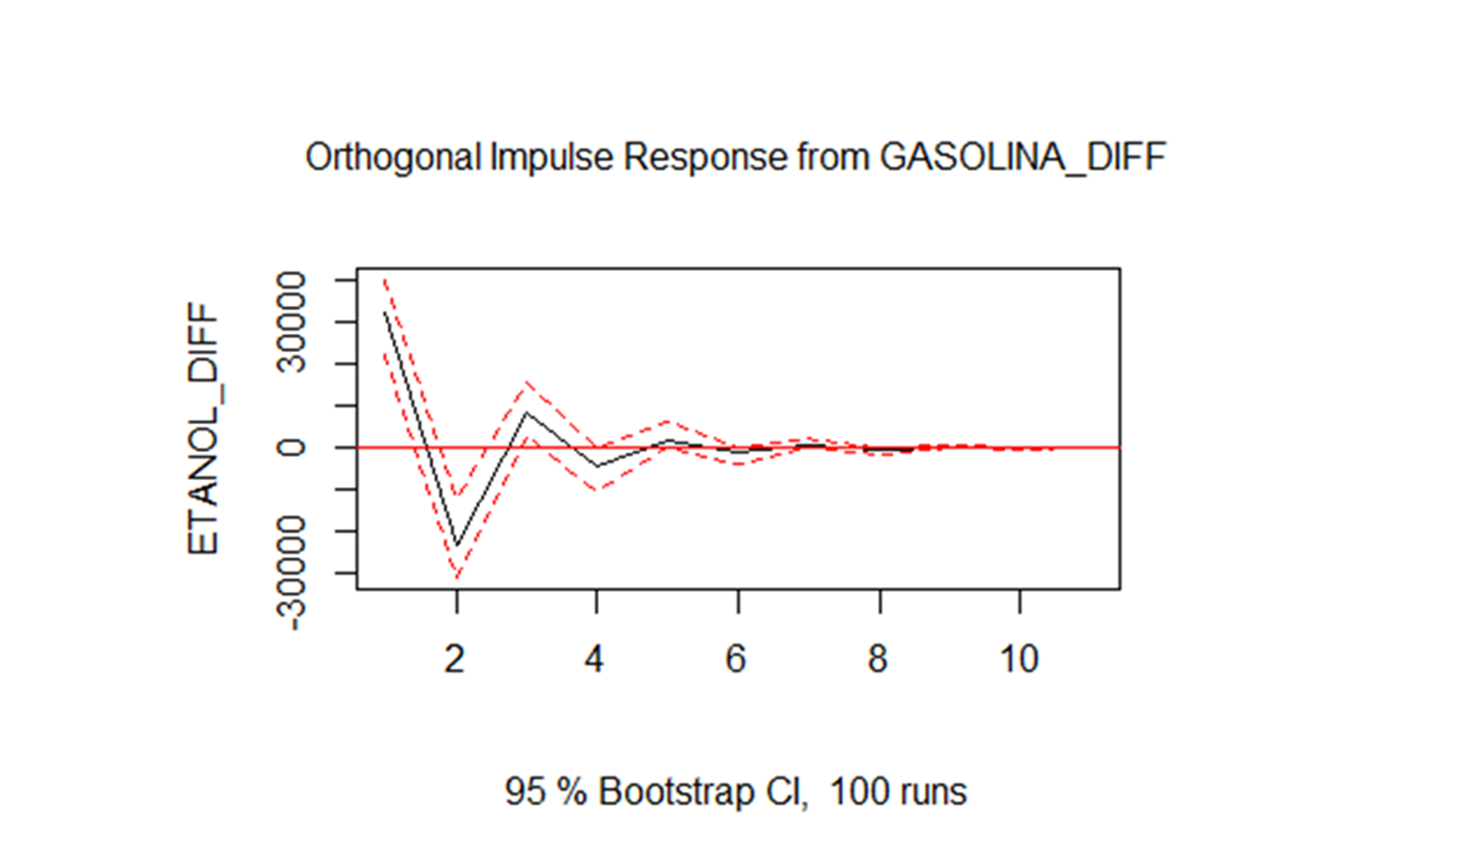
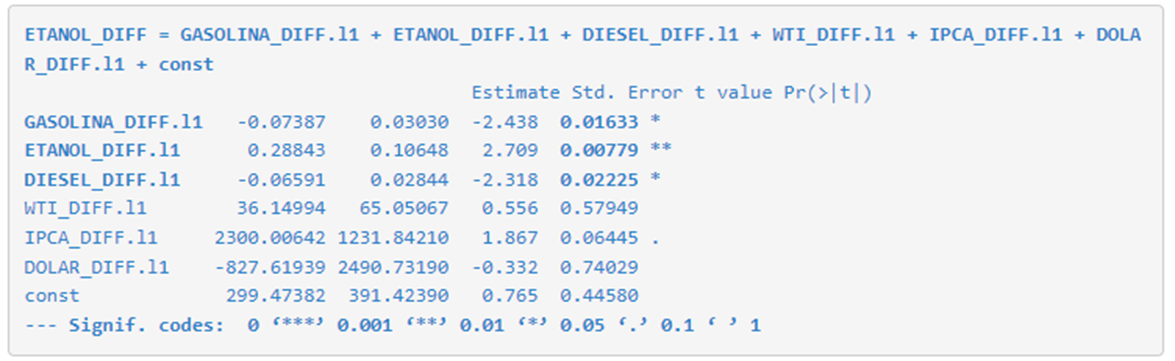
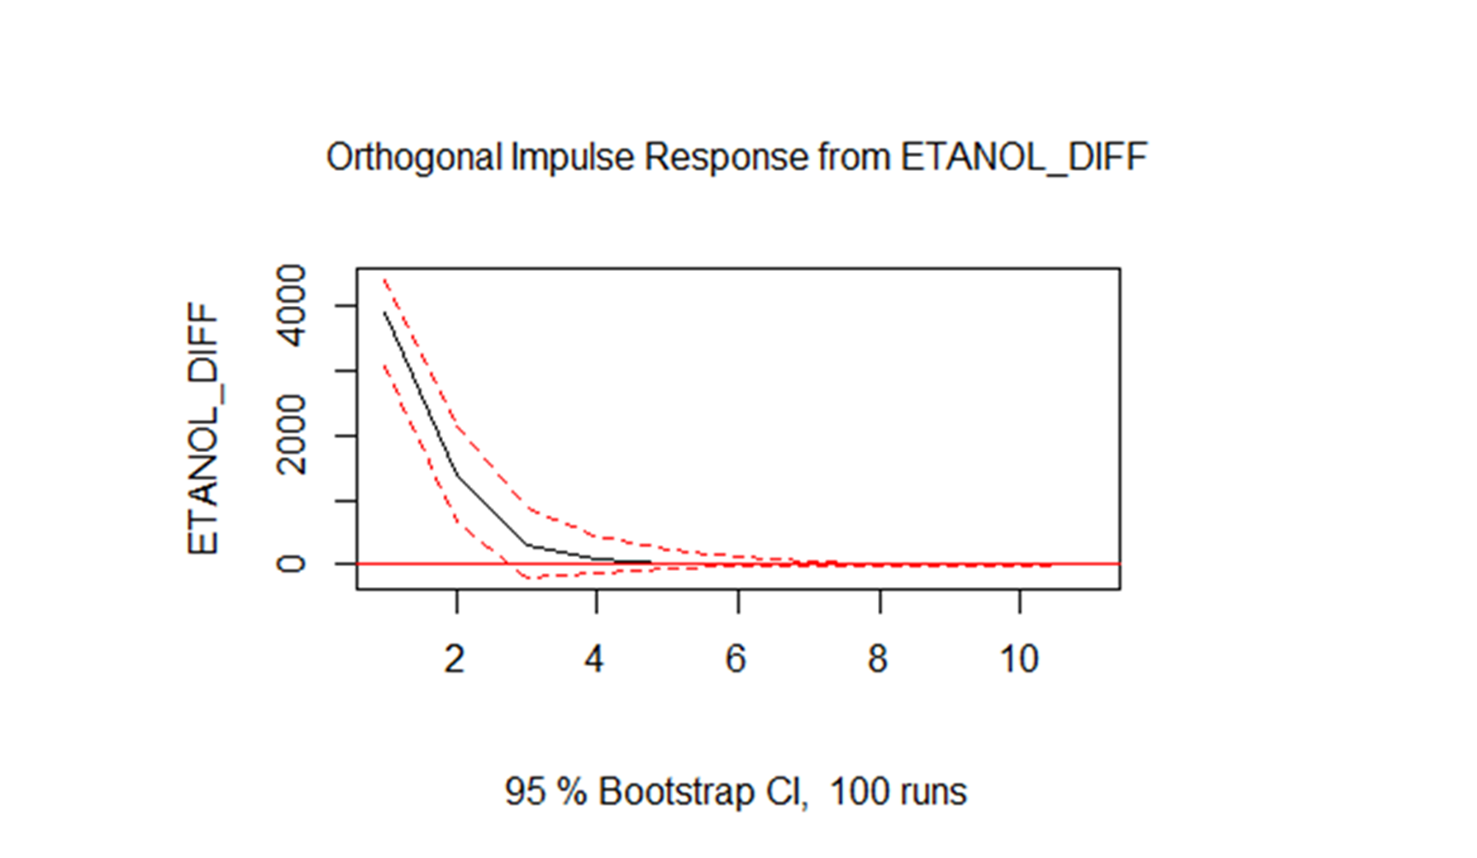
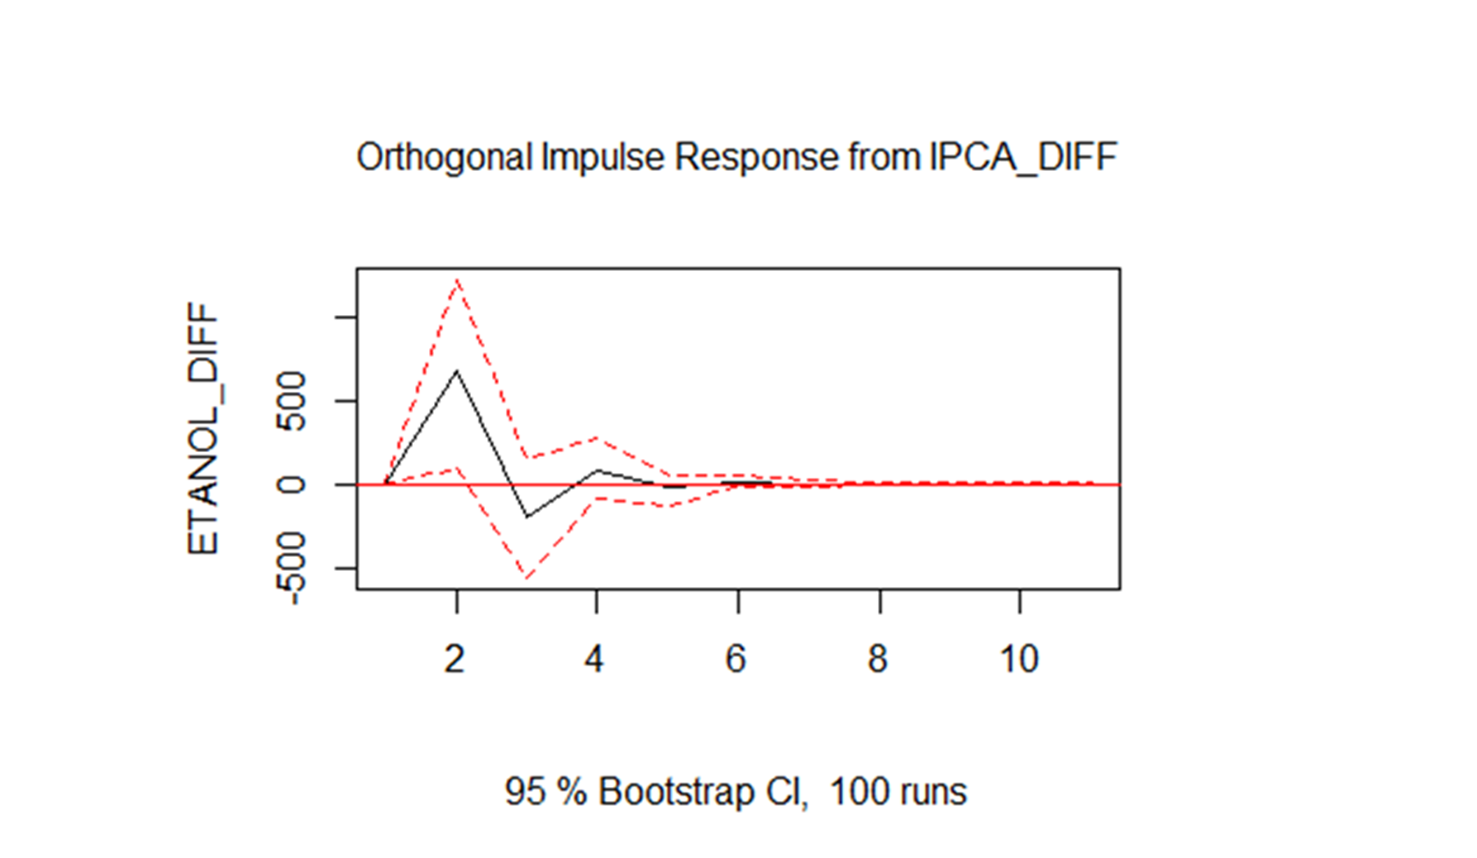
Equation 8: Ethanol - State of Bahia
| Causality of Granger | FIR – Impulse ↑ in X | ||||
| Y | X | Result | P-value | Lag | Result in Y |
| Ethanol | Gasoline | Approved | 0.01633 | 1 | ↑ |
| Causality of Granger | FIR – Impulse ↑ in X | ||||
| Y | X | Result | P-value | Lag | Result in Y |
| Ethanol | Ethanol | Approved | 0.00779 | 1 | ↑ |
| Causality of Granger | FIR – Impulse ↑ in X | ||||
| Y | X | Result | P-value | Lag | Result in Y |
| Ethanol | Diesel | Approved | 0.06445 | 1 | ↓ |
| Causality of Granger | FIR – Impulse ↑ in X | ||||
| Y | X | Result | P-value | Lag | Result in Y |
| Ethanol | IPCA | Approved | 0.02225 | 1 | ↑ |
Equation 9: Diesel - State of Bahia
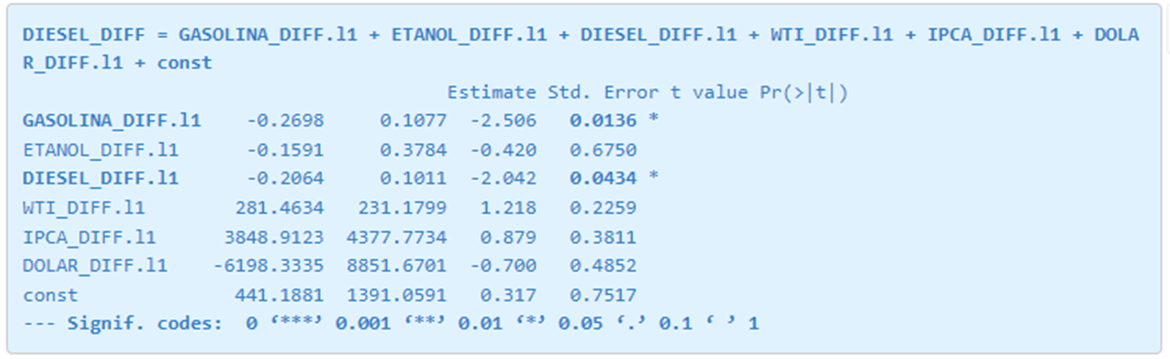
| Causality of Granger | FIR – Impulse ↑ in X | ||||
| Y | X | Result | P-value | Lag | Result in Y |
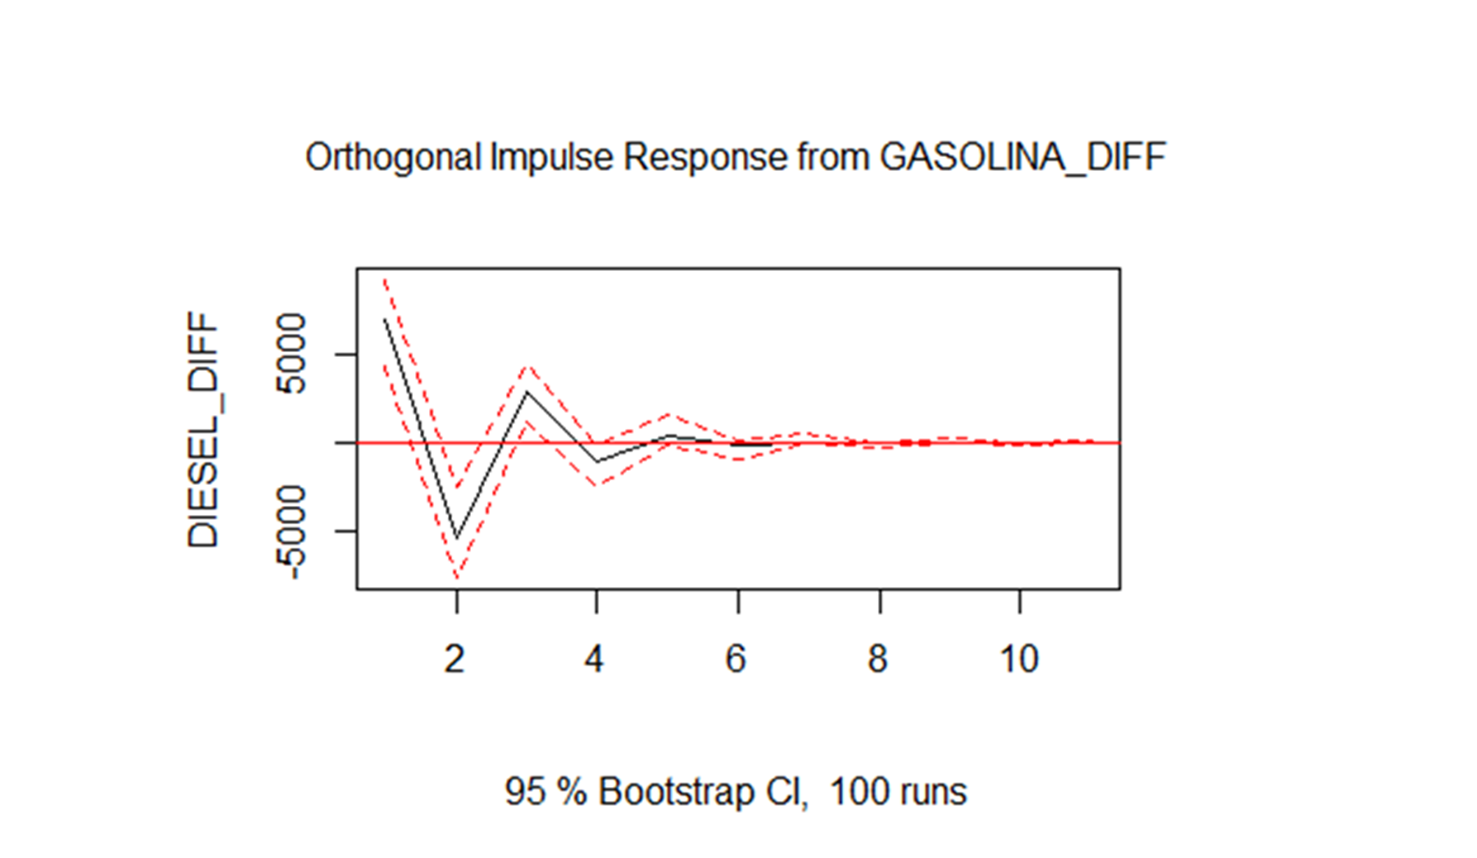
| Diesel | Gasoline | Approved | 0.0136 | 1 | ↑↓ |
| Causality of Granger | FIR – Impulse ↑ in X | ||||
| Y | X | Result | P-value | Lag | Result in Y |
| Diesel | Diesel | Approved | 0.0434 | 1 | ↑ |
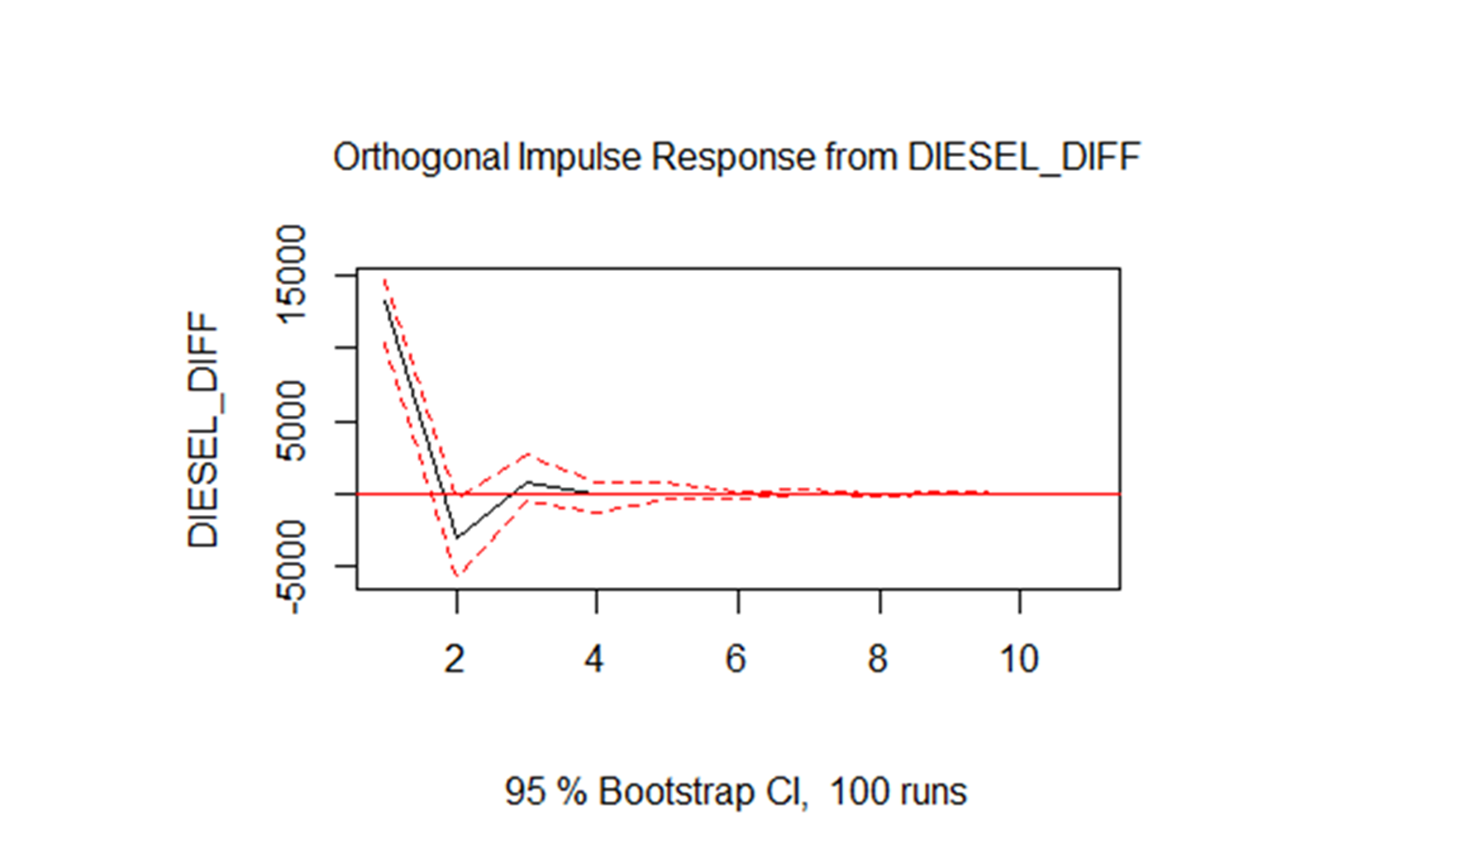
CONCLUSIONS FOR THE STATE OF BAHIA
1. Increase in gasoline sales, increases sales of gasoline and diesel, for approximately one month
2. Increase in ethanol sales, increases sales of ethanol itself, for approximately four months
3. Increase in diesel sales, decrease in ethanol sales for approximately four months
4. Increase in IPCA, increases ethanol sales for approximately four months
5. Increase in diesel sales, increases sales of diesel itself, for approximately two months
References
ANP. Vendas de derivados de petróleo e biocombustíveis em: https://dados.gov.br/dataset/vendas-de-derivados-de-petroleo-e-biocombustiveis acessado 10 maio 2022
BACEN. Decomposição da inflação de 2021 em: https://www.bcb.gov.br/content/ri/relatorioinflacao/202203/ri202203b9p.pdf acessado em 9 maio 2022
BACEN. Apresentação do Relatório de Inflação – setembro de 2021 em: https://www.bcb.gov.br/conteudo/home-ptbr/TextosApresentacoes/AP_RTI_Set2021.pdf acessado em 8 maio 2022
EPE. Plano Decenal de Expansão de Energia 2031 em: https://www.epe.gov.br/sites-pt/publicacoes-dados-abertos/publicacoes/Documents/PDE%202031_RevisaoPosCP_rvFinal.pdf acessado em 9 maio 2022
CBIE. Como é Feito o Transporte de cargas no Brasil? em: https://cbie.com.br/artigos/como-e-feito-o-transporte-de-cargas-no-brasil/ acessado em 10 maio 2022
IBGE. IPCA - Índice Nacional de Preços ao Consumidor Amplo, em: https://www.ibge.gov.br/estatisticas/economicas/precos-e-custos/9256-indice-nacional-de-precos-ao-consumidor-amplo.html?=&t=destaques acessado em 5 maio 2022.
IBP. Impacto do preço dos combustíveis e eletricidade na inflação em: https://www.ibp.org.br/observatorio-do-setor/snapshots/impacto-dos-combustiveis-na-inflacao/ acessado em 7 maio 2022
IBP. Evolução das vendas de combustíveis líquidos em: https://www.ibp.org.br/observatorio-do-setor/snapshots/evolucao-das-vendas-de-combustiveis-liquidos/ acessado em 6 maio 2022
IBP. Evolução do consumo de diesel e atividade econômica em: https://www.ibp.org.br/observatorio-do-setor/snapshots/consumo-de-diesel-e-atividade-economica/ acessado em 6 maio 2022
ECONOMÁTICA. Series temporais do valor do dólar, IPCA e WTI.