Commitment of the minimum wage to gas cylinders in four municipalities in Santa Catarina: unsustainable growth
By Gabriel Dudena de Faria (Probolsas scholar) and Daniel Christian Henrique
Financial news reports have been spreading widely since November 2021 the constant increases in gas cylinder (LPG) in the domestic market, with greater emphasis on the last months of April and May (I.E. MONEY, 2022a; PORTAL LITORAL SUL, 2022), bringing a comparison of how much this gas represents in the minimum wage for the Brazilian worker. The high series, however, already lasts for two years. In FGV studies, the value of the gas cylinder has a representativeness of 8.4% of the Brazilian minimum wage (CNN, 2022).
To make the situation even more critical, according to the president of the National Union of Liquefied Petroleum Gas Distributors (Sindigás), there is no forecast of a fall for the near future (CNN, 2022). As a matter of fact, kitchen gas is a basic necessity, sales of the 13 kg gas canister have increased by 5.3% since 2019 (PETROBRAS, 2022). Thus, the percentage ratio between the average price of lPG / Minimum Wage that rarely goes from the average between 6.0% and 8.0% since 2007, exploded, reaching today to be above 10% (PETROBRAS, 2022). This fact is changing the way many Brazilians cook, abandoning cooking gas and returning to the old wood stove.
Last week (05/06/2022 to 11/06/2022) all this scenario was again very highlighted when the 13 kg canister reached the expressive value of R$ 160.00 in the city of Caçador, in Santa Catarina, the largest ever recorded in a municipality of its entire time series, compromising 13.2% of the minimum wage of the city's workers, a record (PORTAL LITORAL SUL, 2022).
Taking as reference the studies published by FGV and Petrobras, a research with greater specificity was developed in this scientific report by analyzing the percentage relationship between the average annual price of the 13 kg gas cylinder (LPG) with the Minimum Wage for the four largest cities of Santa Catarina: Florianópolis, Balneario Camboiú, Joinville and Blumenau - with subsequent comparison to the same ratio reached last week . The time series of the Minimum Wage (R$) was collected at the Central Bank of Brazil (BCB, 2022) and the average and maximum lPG price series (R$/13kg) for each city were obtained from the National Agency for Petroleum, Natural Gas and Biofuels (ANP, 2022a, 2022b). All series are monthly, collected from January 2012 to June 2022 (whenever 2022 is mentioned until the first week of June) and passed to annual series through the use of averages.
Santa Catarina 05/06/2022 to 10/06/2022
For comparison with the present moment, the prices and comparisons of the most current week (13/06/2022) of the realization of this report (ANP, 2022) will be presented below; BCB, 2022).
| Data | Florianópolis | Blumenau | Joinville | Balneario Camboriu |
| Minimum wage | R$ 1,212.00 | R$ 1,212.00 | R$ 1,212.00 | R$ 1,212.00 |
| Average LPG | R$ 120,36 | R$ 132,00 | R$ 117.75 | R$ 132,00 |
| Maximum LPG | R$ 123.08 | R$ 132,00 | R$ 120,00 | R$ 138,00 |
| Average LPG / Salary | 9,93% | 10,89% | 9,72% | 10,89% |
| Maximum LPG / Salary | 10,16% | 10,89% | 9,90% | 11,39% |
Florianópolis
| Year | Minimum wage | Average Price | Maximum Price | Average Price/Salary | Maximum Price/Salary |
| 2012 | R$ 662,00 | R$ 43,65 | R$ 47,62 | 6,59339% | 7,19348% |
| 2013 | R$ 678,00 | R$ 44,51 | R$ 48,04 | 6,56477% | 7,08579% |
| 2014 | R$ 724,00 | R$ 45,61 | R$ 49,00 | 6,29956% | 6,76796% |
| 2015 | R$ 788,00 | R$ 50,52 | R$ 53,83 | 6,41163% | 6,83164% |
| 2016 | R$ 880,00 | R$ 56,40 | R$ 61,33 | 6,40937% | 6,96970% |
| 2017 | R$ 937,00 | R$ 60,14 | R$ 65,91 | 6,41850% | 7,03397% |
| 2018 | R$ 954,00 | R$ 70,21 | R$ 77,00 | 7,36000% | 8,07128% |
| 2019 | R$ 998,00 | R$ 71,09 | R$ 73,10 | 7,12315% | 7,32465% |
| 2020 | R$ 1,045.00 | R$ 75,53 | R$ 78,13 | 7,22755% | 7,47608% |
| 2021 | R$ 1,100.00 | R$ 98,54 | R$ 101,91 | 8,95816% | 9,26477% |
| 2022* | R$ 1,212.00 | R$ 118,20 | R$ 126.06 | 9,75253% | 10,40072% |
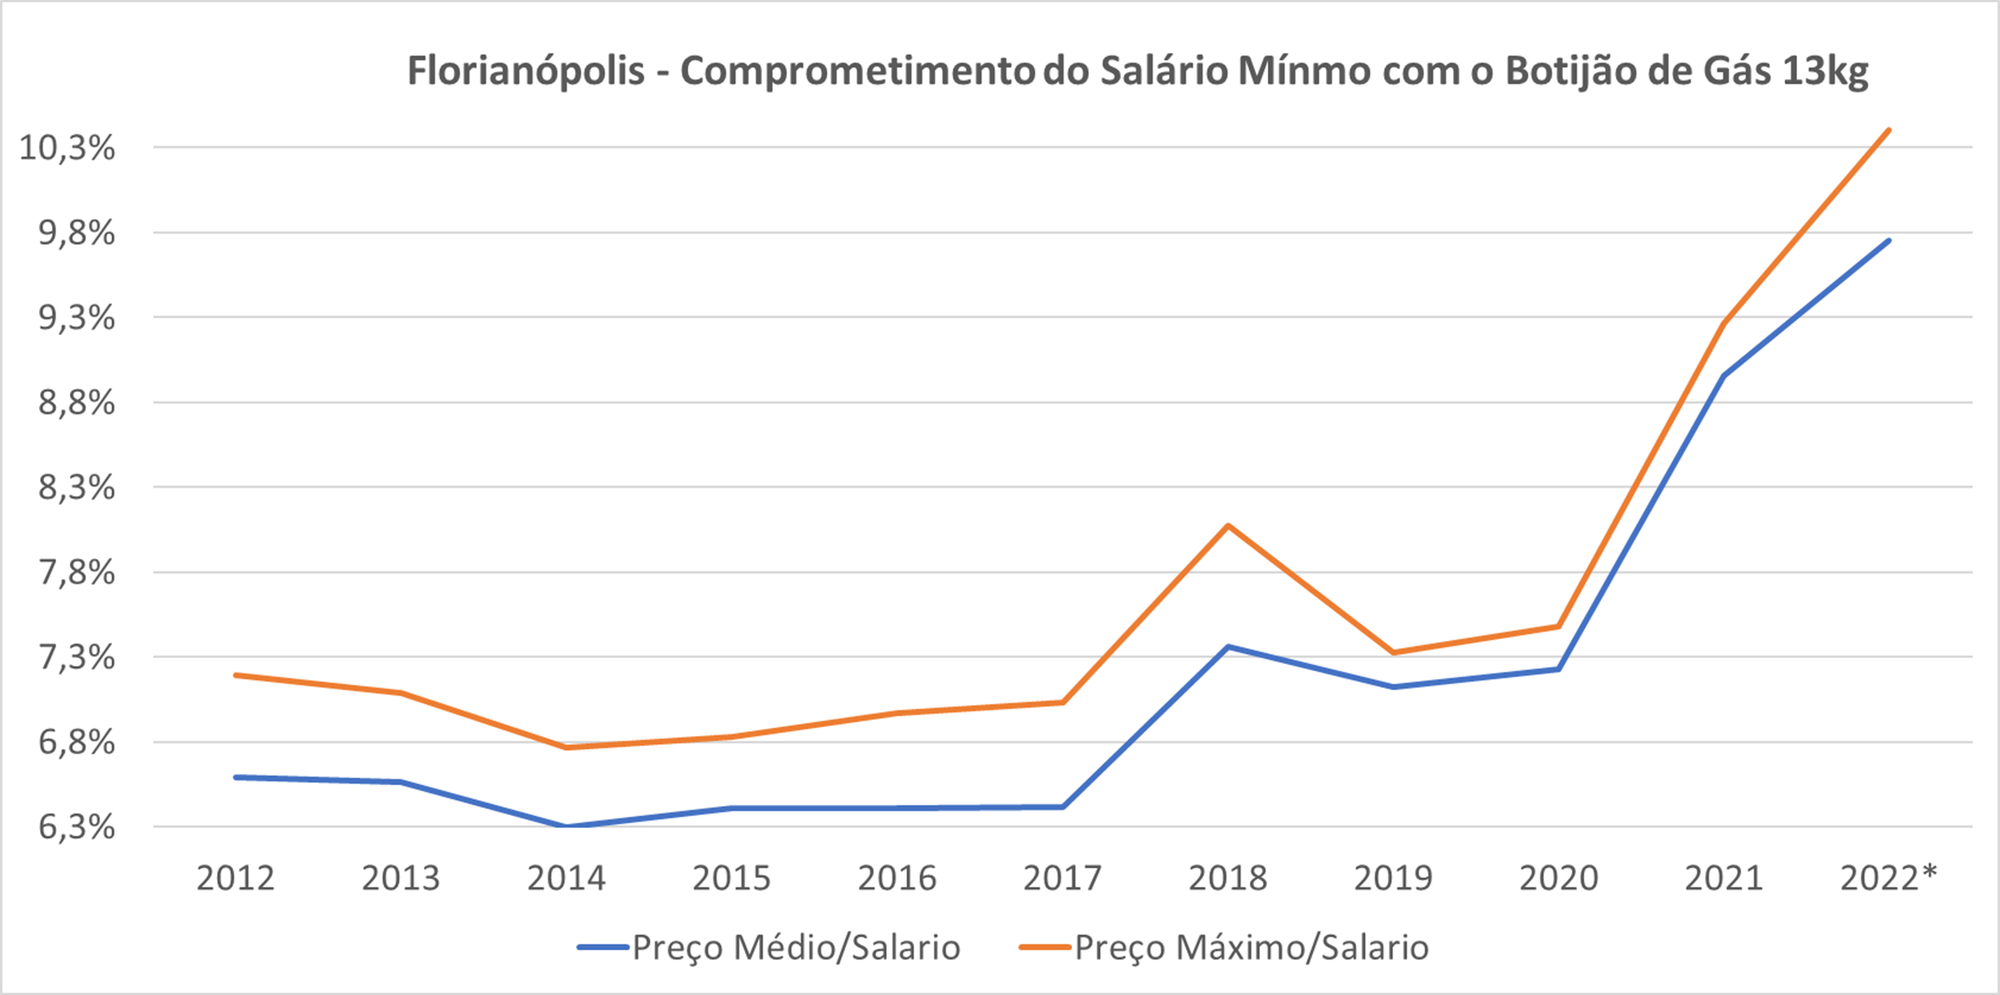
*until the first week of June 2022
Blumenau
| Year | Minimum wage | Average Price | Maximum Price | Average Price/Salary | Maximum Price/Salary |
| 2012 | R$ 662,00 | R$ 40,29 | R$ 47,62 | 6,08620% | 7,19348% |
| 2013 | R$ 678,00 | R$ 45,56 | R$ 48,90 | 6,71930% | 7,21239% |
| 2014 | R$ 724,00 | R$ 46,44 | R$ 48,42 | 6,41405% | 6,68738% |
| 2015 | R$ 788,00 | R$ 52,12 | R$ 55,42 | 6,61471% | 7,03257% |
| 2016 | R$ 880,00 | R$ 59,21 | R$ 63,96 | 6,72851% | 7,26799% |
| 2017 | R$ 937,00 | R$ 61.29 | R$ 66,92 | 6,54064% | 7,14159% |
| 2018 | R$ 954,00 | R$ 74,51 | R$ 81,58 | 7,81052% | 8,55171% |
| 2019 | R$ 998,00 | R$ 73,66 | R$ 76,06 | 7,38110% | 7,62124% |
| 2020 | R$ 1,045.00 | R$ 78,52 | R$ 81,53 | 7,51376% | 7,80223% |
| 2021 | R$ 1,100.00 | R$ 111.27 | R$ 113.24 | 10,11528% | 10,29470% |
| 2022* | R$ 1,212.00 | R$ 124.76 | R$ 132.33 | 10,29337% | 10,91859% |
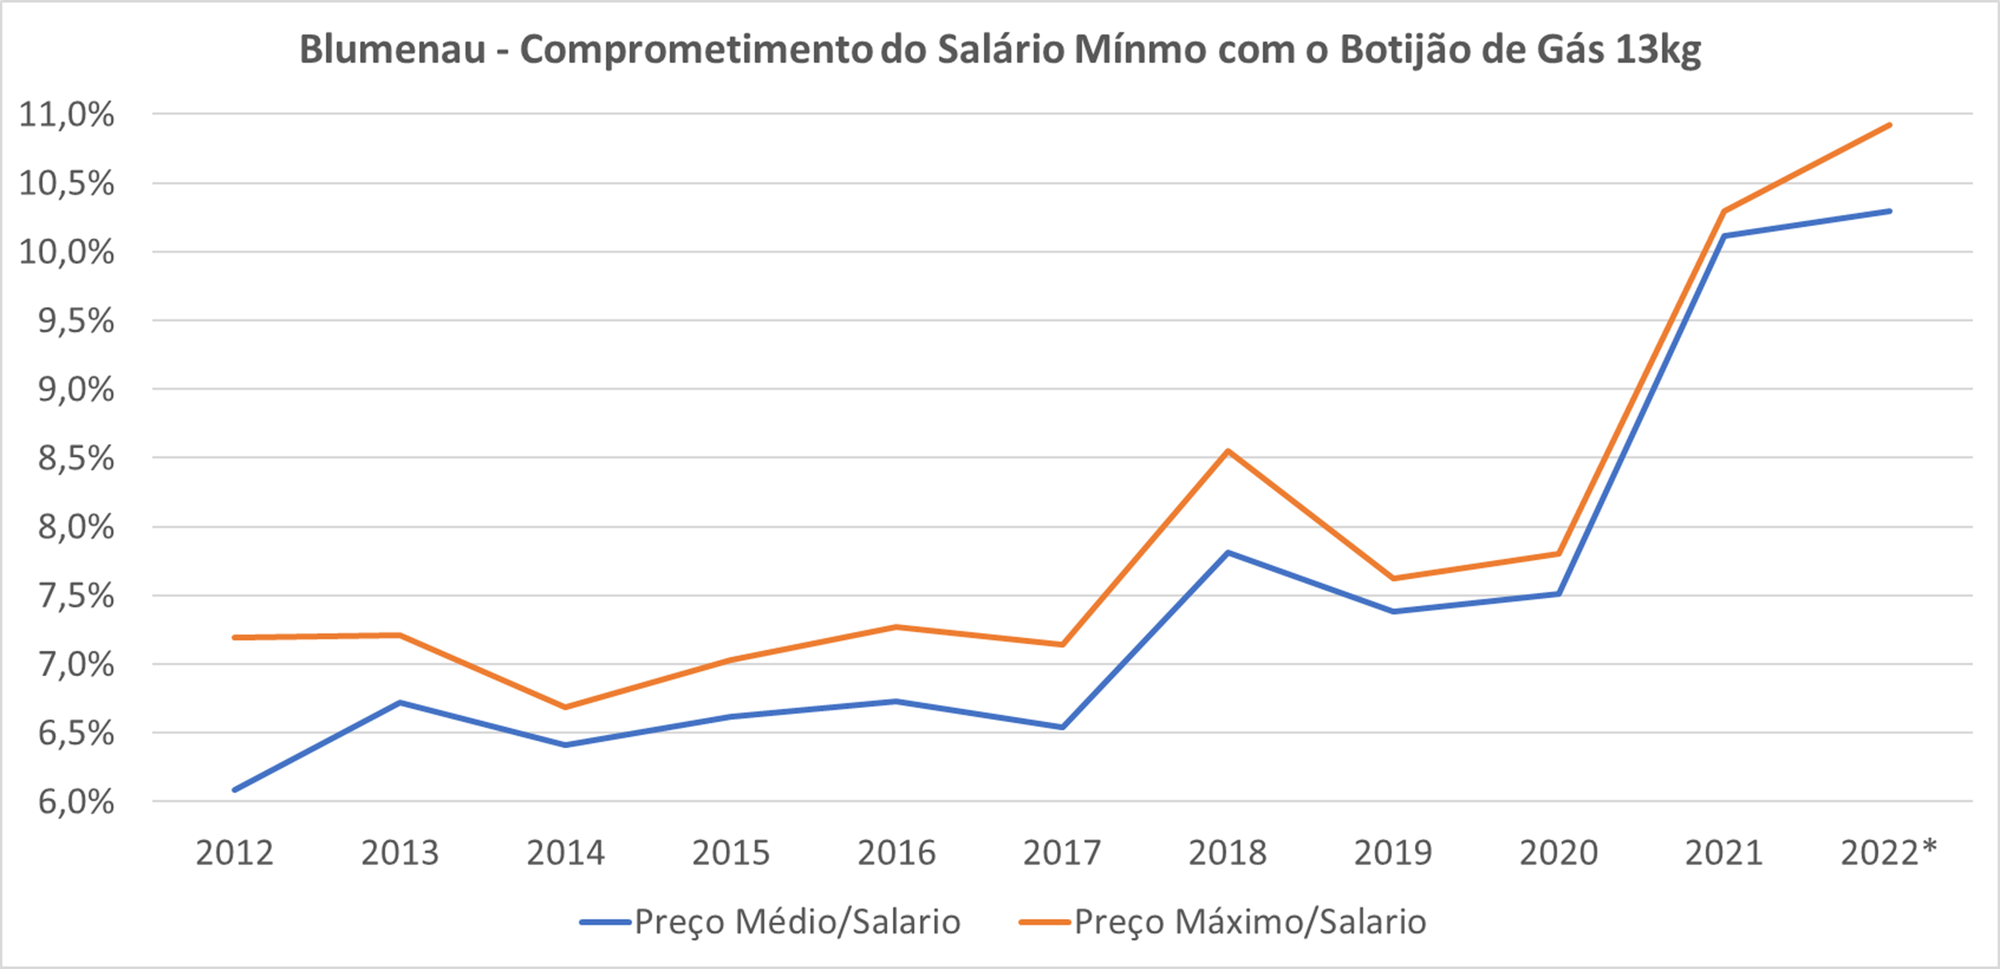
*until the first week of June 2022
Joinville
| Year | Minimum wage | Average Price | Maximum Price | Average Price/Salary | Maximum Price/Salary |
| 2012 | R$ 662,00 | R$ 37,25 | R$ 44,60 | 5,62699% | 6,73716% |
| 2013 | R$ 678,00 | R$ 40,81 | R$ 45,47 | 6,01867% | 6,70600% |
| 2014 | R$ 724,00 | R$ 42,86 | R$ 47,83 | 5,92056% | 6,60681% |
| 2015 | R$ 788,00 | R$ 47,96 | R$ 51,83 | 6,08613% | 6,57783% |
| 2016 | R$ 880,00 | R$ 52.29 | R$ 55,17 | 5,94228% | 6,26894% |
| 2017 | R$ 937,00 | R$ 58,87 | R$ 63,67 | 6,28261% | 6,79473% |
| 2018 | R$ 954,00 | R$ 69.98 | R$ 75,92 | 7,33497% | 7,95772% |
| 2019 | R$ 998,00 | R$ 70,39 | R$ 73,90 | 7,05271% | 7,40481% |
| 2020 | R$ 1,045.00 | R$ 79,32 | R$ 85,13 | 7,59049% | 8,14593% |
| 2021 | R$ 1,100.00 | R$ 107.33 | R$ 117,70 | 9,75690% | 10,70000% |
| 2022* | R$ 1,212.00 | R$ 118.38 | R$ 121.17 | 9,76691% | 9,99725% |
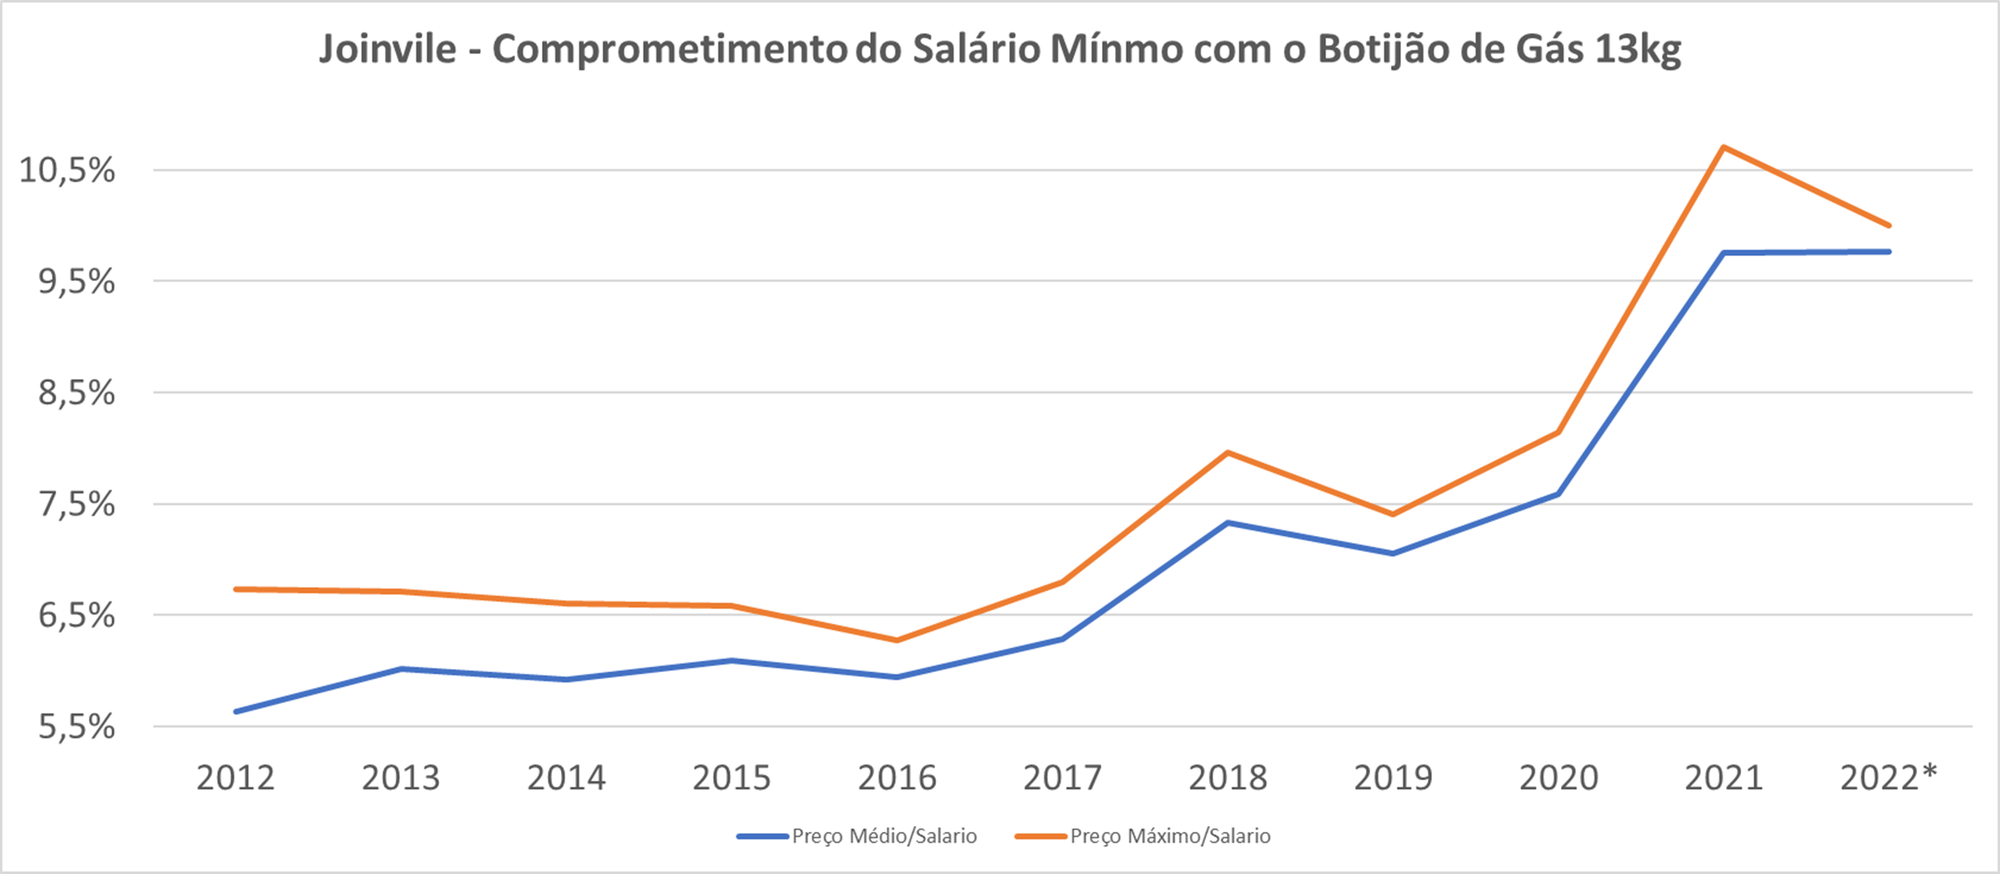
*until the first week of June 2022
Balneario Camboriu
| Year | Minimum wage | Average Price | Maximum Price | Average Price/Salary | Maximum Price/Salary |
| 2012 | R$ 662,00 | R$ 43,57 | R$ 45,42 | 6,58153% | 6,86052% |
| 2013 | R$ 678,00 | 41,011 | R$ 42,33 | 6,04884% | 6,24385% |
| 2014 | R$ 724,00 | 40,785 | R$ 42,17 | 5,63331% | 5,82413% |
| 2015 | R$ 788,00 | 45,748 | R$ 46,52 | 5,80557% | 5,90366% |
| 2016 | R$ 880,00 | 53,73 | R$ 55,92 | 6,10571% | 6,35417% |
| 2017 | R$ 937,00 | 63,643 | R$ 65,83 | 6,79216% | 7,02597% |
| 2018 | R$ 954,00 | 74,299 | R$ 76,50 | 7,78816% | 8,01887% |
| 2019 | R$ 998,00 | 75,225 | R$ 77,50 | 7,53758% | 7,76553% |
| 2020 | R$ 1,045.00 | 75,376 | R$ 78,34 | 7,21301% | 7,49629% |
| 2021 | R$ 1,100.00 | 99,862 | R$ 101.41 | 9,07836% | 9,21878% |
| 2022* | R$ 1,212.00 | 127,455 | R$ 133.58 | 10,51610% | 11,02173% |
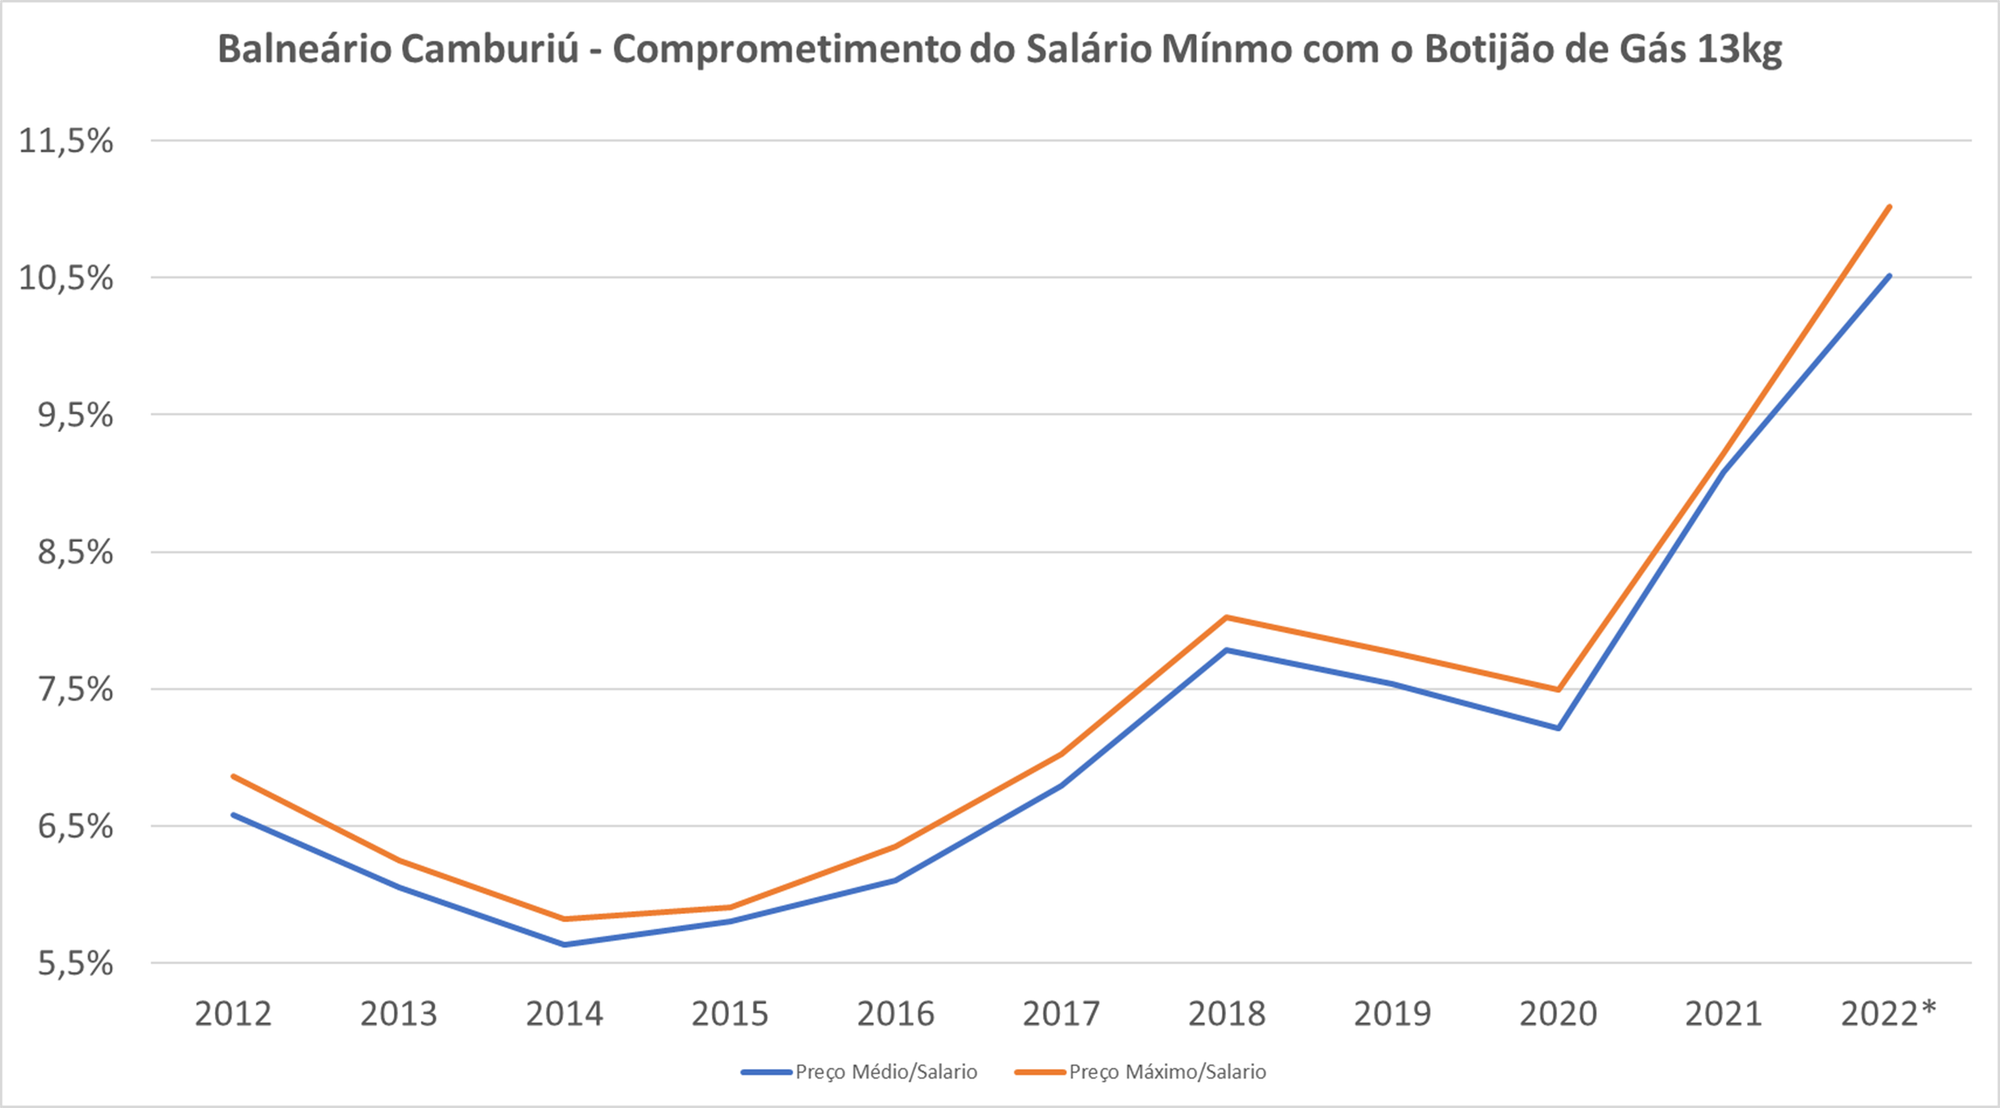
*until the first week of June 2022
CONCLUSIONS
1 – The percentage ratios of last week (05/06 to 11/06/2022) between the average price of the canister with the minimum wage were higher than the average annual records of the entire series of values of this same ratio since 2012 for the cities of Florianópolis, Blumenau and Balneário Camboiú.
2 – The highest percentage found of the minimum wage commitment to the average and maximum price of the gas cylinder was in Balneario Cambolu, reaching 10.51% and 11.22% of commitment, respectively.
3 – The lowest percentage ratio found between the average price of the canister and the minimum wage was 5.63% for Joinville in 2012 and for Balneario Cambolu in 2014
4 - The lowest percentage ratio found between the maximum price of the canister and the minimum wage was 5.82% for Balneario Cambour in 2014
5 – In the four cities of Santa Catarina there was a significant increase from 2020 onthe percentage ratio between the price of the gas cylinder and the minimum wage. For Joinville alone, there was a slight reduction in the year 2022 in the maximum price ratio of the canister with the minimum wage.
6 – In the city of Balneario Cambour, throughout the time period analyzed, the average price of the canister / minimum wage and maximum price of the canister / minimum wage remained very close percentage values.
7 – In Blumenau the significant increase in 2020 of the two relationships analyzed was also very close, only diverging from 2021, but both still in the high sense
References:
ANP. Preços de Revenda e de Distribuição de Combustíveis. Acesso em 02 de maio 2022
PETROBRAS. Como preços são formados. Acesso em 13 de junho de 2022a
PETROBRAS. Fatos e dados sobre o gás de cozinha (o GLP) Acesso em 13 de junho de 2022b
ANP. Preços de GLP ao consumidor Acesso em 13 de junho de 2022
MINISTÉRIO DE MINAS E ENERGIA. Nota à imprensa: consumo de GLP Acesso em 13 de junho de 2022
CNN Brasil. Preço do botijão de gás no Brasil tem alta de quase 50% em dois anos Acesso em 13 de junho de 2022
BCB. Séries Temporais do Banco Central. Acesso em 13 de junho de 2022 ISTO É DINHEIRO. Preço do gás de cozinha é o maior do século e compromete 9,4% do salário mínimo, 2022a Acesso em 15 de junho de 2022
PORTAL LITORAL SUL. Gás de cozinha: botijão em Santa Catarina é o mais caro do Brasil Acesso em 15 de junho de 2022