Retail companies and IBOV on the rise: an inter-relationship?
By Daniel Christian Henrique
With the emergence of the pandemic and the closing and constant reopening of local businesses, online shopping has become more than routine, accounting for the entry of a large number of users who were not yet adept at this mode of purchase. Since the biggest fall of B3 in late March, the Brazilian stock index has been recovering, reaching 100,000 points last week, very close to 105,000 points on February 26 (B3, 2020), when the first case of infection emerged by covid-19 in Brazil. The stock exchange has routinely followed international indexes, as news reports of vaccine advances against covid-19 advance or new international markets are reactivated. Several fluctuations could still be seen, with repercussions on the index on certain days related to national policy, as well as other endogenous motivations.
However, the fact that large companies in the retail segment with Via Varejo, Magazine Luiza and Lojas Americanas have already fully recovered the value of their quotations and even surpassing them when compared to the end of February (ECONOMÁTICA, 2020), appears the question: are the return of these companies and their volatilities also influencing the recover of B3? Or, on the other hand, would the gradual resumption of the stock market have a positive impact on investments in this segment, which tends to materialize even more in society in the post-pandemic period? Below you can see in the graphs the evolution of the quotes of each company and the B3 score from February 26, 2020 until July 12, 2020:
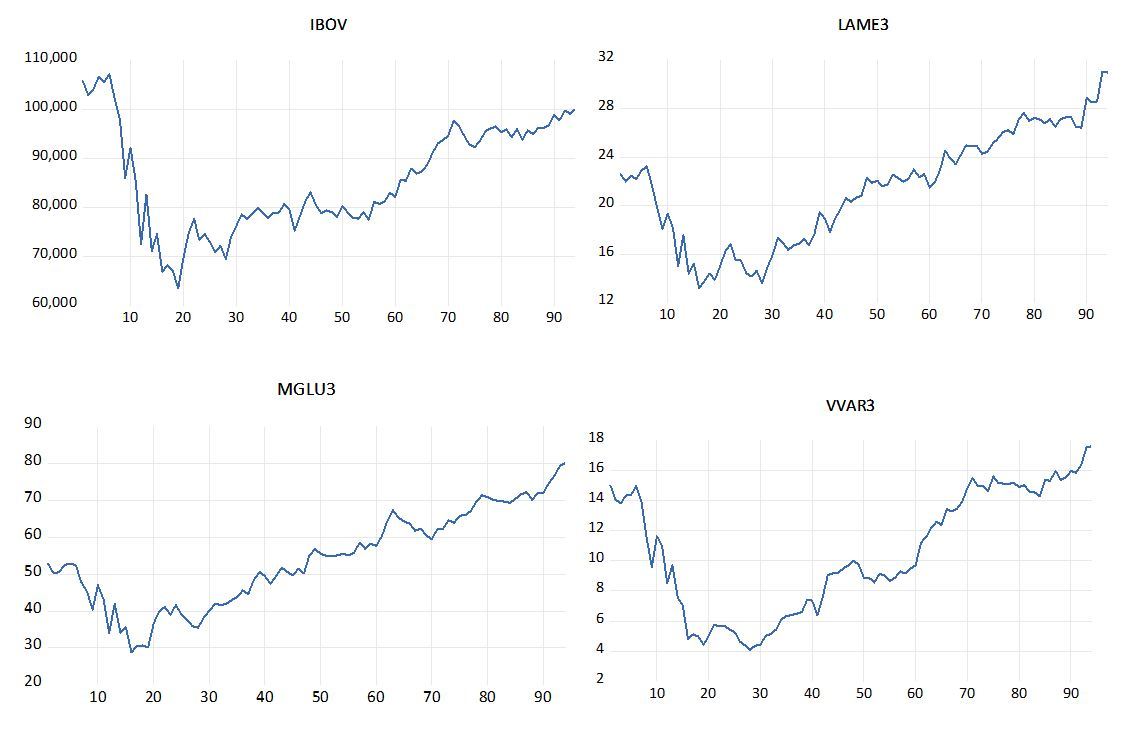
Fonte: Economatica (2020)
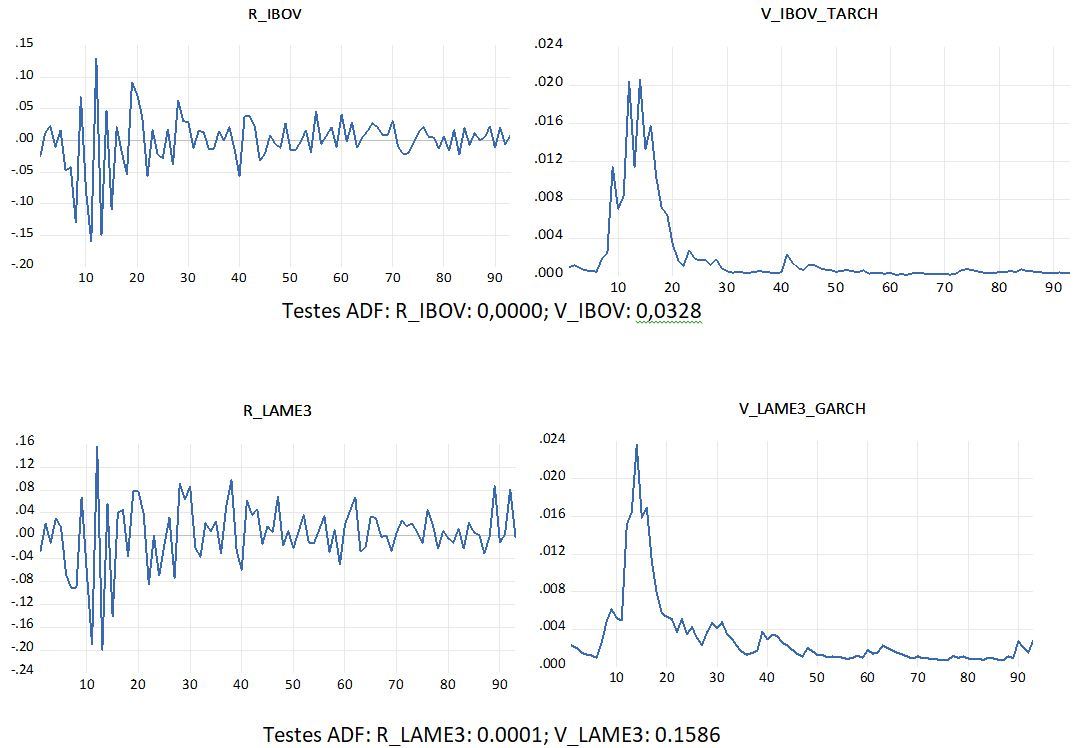
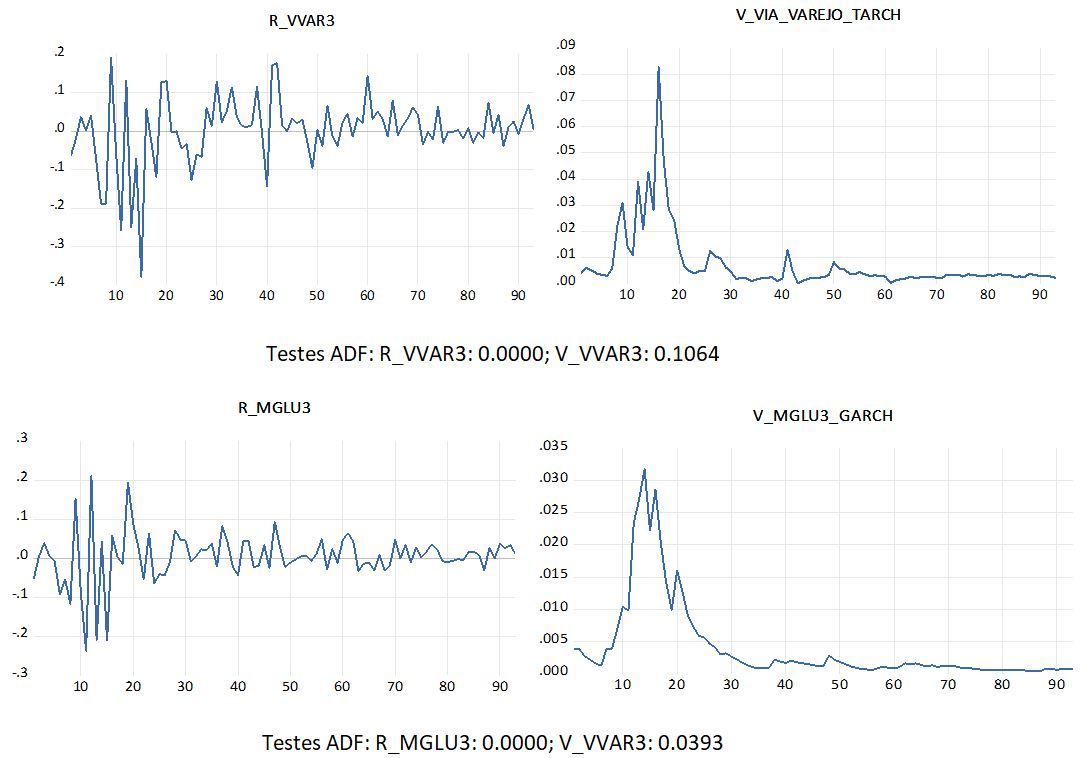
This type of analysis requires the use of Autoregressive Vectors (VAR), as they are analyzes of interrelationships between variables characterized by time series. The series with their returns were used, via difference in natural logarithms. Three Garch family volatility models were tested for each return: Garch (1, 1), Tarch (1, 1) and Egarch (1, 1), taking as winner the one with the lowest values of AIC, BIC AND SQC. If the chosen volatility did not pass the Augmented Dickey–Fuller (ADF) test of stationarity, the second best placed in the selection was chosen. All series showed stationarity, refuting the null hypothesis of the existence of a unit root. Exception occurred with Garch (1, 1) from LAME3 (with the other models presenting even higher p-values). However, due to the fact of obtaining disapproval passing only a few percentages of the 10% significance level, it was decided to keep it in the analyzes. Test results are presented next to the return and volatility graphs for each time series, in sequence. There is a high fluctuation in the month of March, resuming a low volatility in the subsequent periods:
In which:
R_IBOV: Return of the Ibovespa index
V_IBOV_TARCH: Tarch volatility (1.1) of the Ibovespa index
R_LAME3: Return of Lojas Americanas stocks
V_LAME3_GARCH: Garch volatility (1.1) of Lojas Americanas stocks
R_VVAR3: Return of Via Varejo stocks
V_VVAR3_TARCH: Tarch volatility (1.1) of Via Varejo stocks
R_MGLU3: Return of Magazine Luiza's stocks
V_MGLU3_GARCH: Volatility Garch (1.1) of Magazine Luiza's stocks
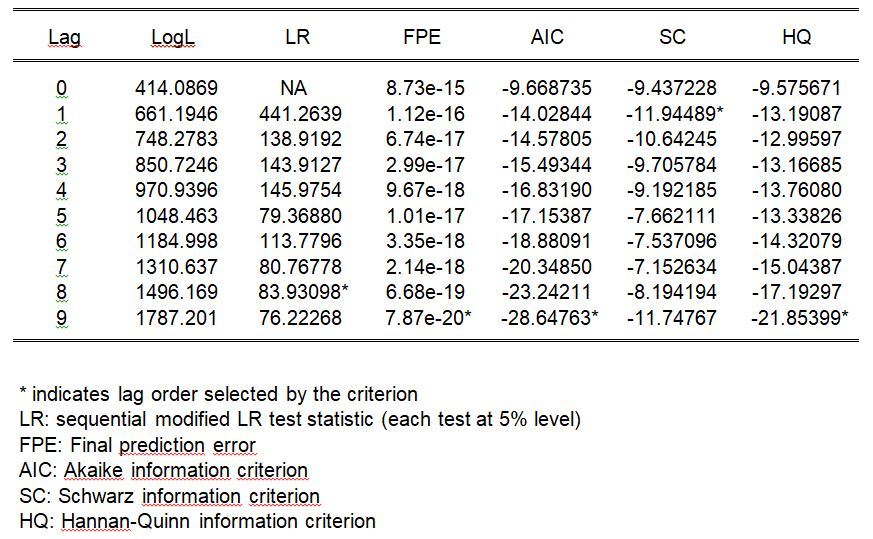
The lags tests necessary to perform the VAR pointed out the need for 9 lags, becoming the best in the FPE, AIC and HQ tests. Lags 2 and 8 presented only one approved test each:
To understand which company could be most influencing B3 or the other way around, Granger's Causality was approached, with its main results in the table in sequence:
Relationship between Returns:
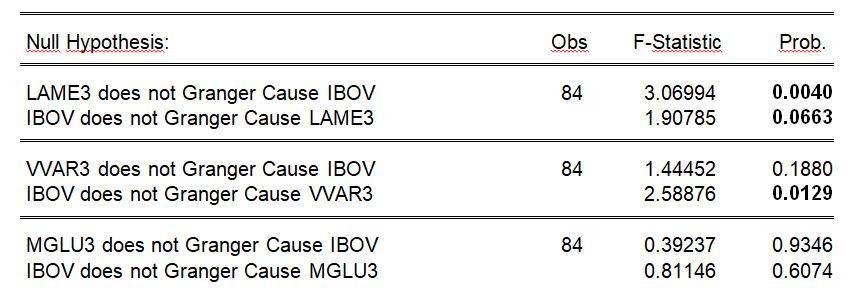
The first highlight is the fact that Lojas Americanas impacts B3 as B3 impacts Lojas Americanas, the only situation of inter-relationship between observed returns, with their p-values refuting null hypotheses. As far as Via Varejo is concerned, it has not been able to influence the stock market, but it is influenced by its ups and downs. The returns from Magazine Luiza and B3 did not show any kind of synergistic follow-up, both with strong approval for the probabilities of the occurrence of their null hypotheses not causing the return of the other variable.
And what would the interrelationships between volatilities look like:
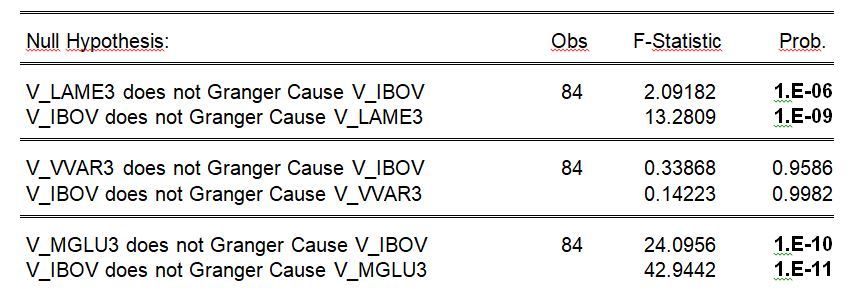
A monitoring of what happened between LAME3 and IBOV previously could also be seen, also with both volatilities causing mutual impacts. B3's volatility is now unable to influence VVAR3's volatility, as it has been effecting on its return. The biggest change arises in the relationship between Magazine Luiza and B3 volatilities, both denoting a strong disapproval of the null hypothesis with zero probability of occurrence, that is, one causing the other.
Regarding the relationship between B3's Return and Retailers' Volatilities, there are some causal changes:
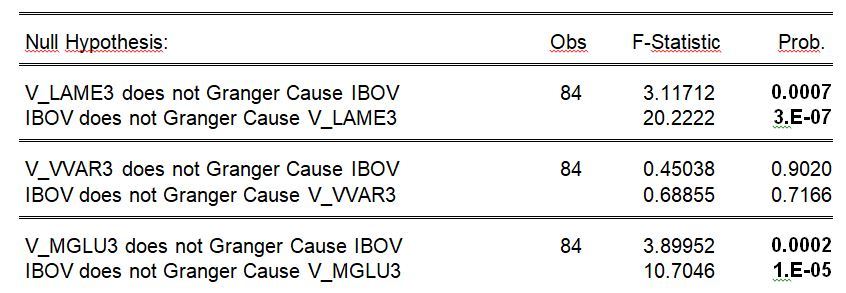
The return of the Ibovespa index and the LAME3 volatility also demonstrate here its intrinsic relationship, keeping the set of reciprocal relationship active. But now B3's return does not demonstrate enough information to cause VVAR3's volatility. And while the returns from IBOV and MGLU3 did not bring a relationship, the opposite demonstrates the company's volatility, speaking at zero probability that it will not influence the return of the stock exchange, as well as the opposite. This finding reinforces that found also between both volatilities.
It is worth mentioning that the observations of relationships between some returns and volatilities of retail companies and the IBOV index do not mean that they are exclusive, but that they are part of a complex network of relationships that generate greater or lesser fluctuations in the values of quotations in certain sectors or segments, reflecting on the national index - which in turn influences other business ramifications.
References
B3. Brasil, Bolsa, Balcão.Available in: http://www.b3.com.br/. Access in: 13 jul. 2020.
ECONOMÁTICA. Plataforma Economatica. Available in: https://economatica.com. Access in: 13 jul. 2020.